Day: September 19, 2026

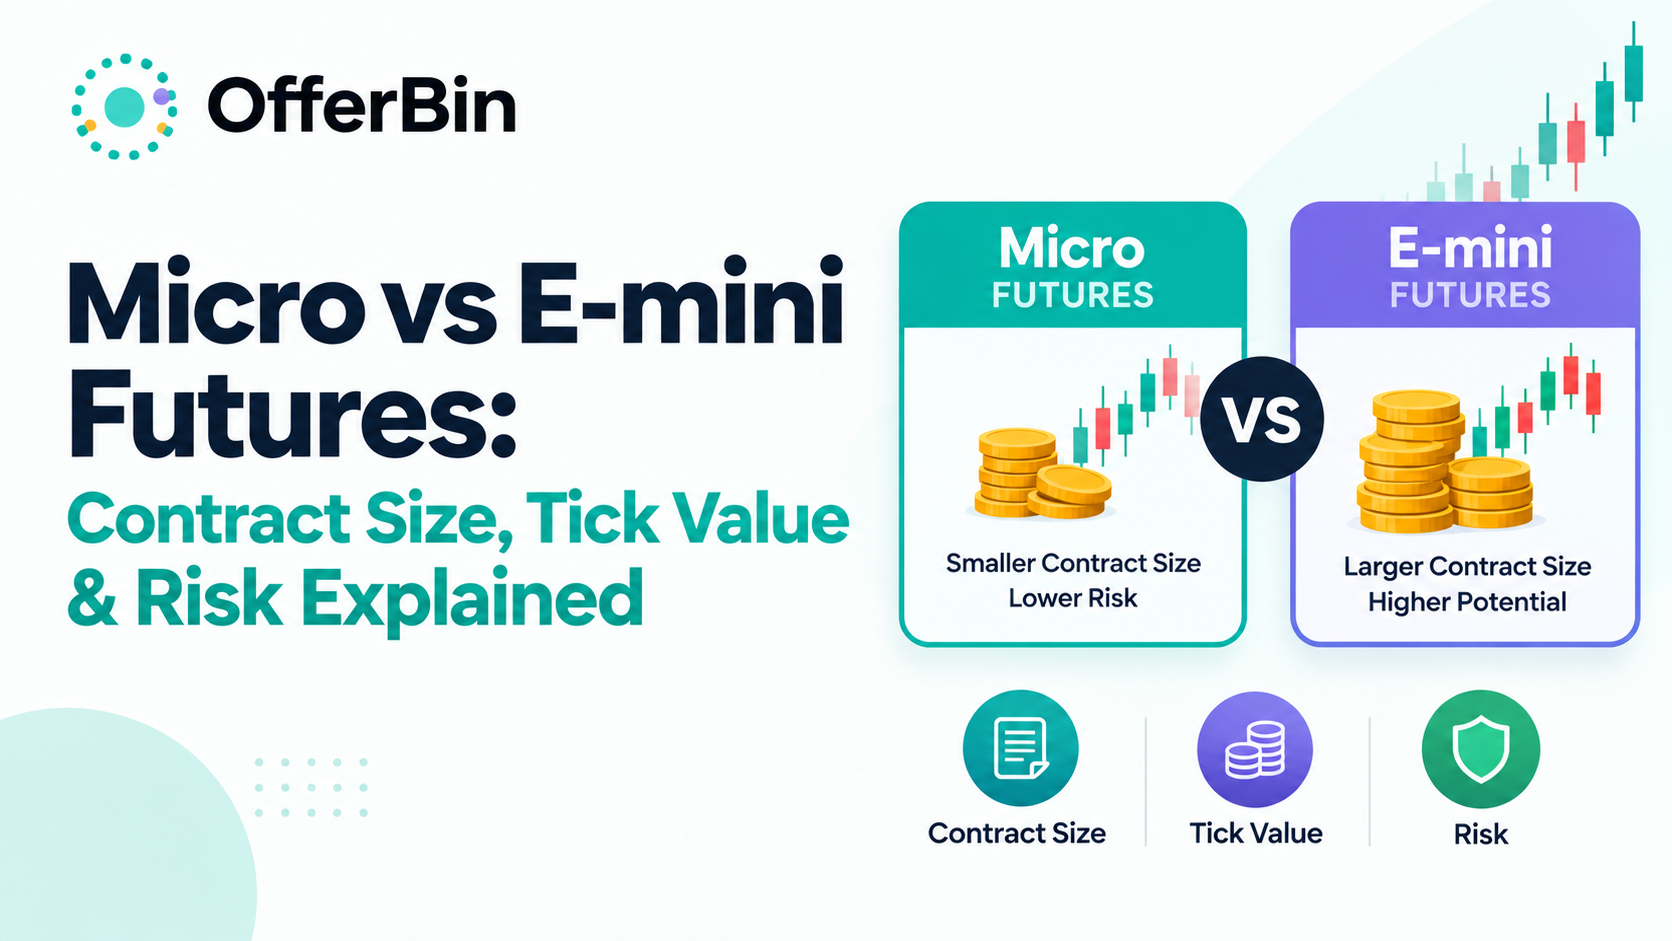
  • Micro vs E-mini Futures: Contract Size, Tick Value & Risk Explained

    Micro vs E-mini Futures: Contract Size, Tick Value & Risk Explained

    If you’re comparing Micro vs E-mini futures, the biggest difference is contract size. Micro E-mini futures generally represent one-tenth the contract size of their corresponding E-mini contracts. That means the underlying market can be the same, while the dollar value of each point and tick is much smaller.

    For example, one E-mini S&P 500 (ES) contract uses a $50 multiplier, while one Micro E-mini S&P 500 (MES) contract uses a $5 multiplier. At an S&P 500 index level of 5,000, that represents approximately $250,000 of notional exposure for ES versus $25,000 for MES.

    That 10-to-1 relationship is the foundation for understanding Micro vs E-mini futures. But contract size is only part of the comparison. Tick value, margin, leverage, trading costs, liquidity, and position sizing also matter.

    Micro vs E-mini Futures: What’s the Difference?

    Micro E-mini futures are smaller-sized versions of major E-mini equity index futures. CME Group currently lists Micro E-mini contracts for major U.S. equity benchmarks including the S&P 500, Nasdaq-100, Dow Jones Industrial Average, and Russell 2000.

    The basic relationship looks like this:

    FeatureMicro E-mini FuturesE-mini Futures
    Contract sizeSmallerLarger
    Typical relationship1/10 of E-mini10× Micro
    Dollar exposure per pointLowerHigher
    Tick valueLowerHigher
    Position sizing flexibilityMore granularLess granular
    Margin requirementGenerally lower, but variesGenerally higher
    Market exposureSame underlying benchmarkSame underlying benchmark
    Main symbolsMES, MNQ, MYM, M2KES, NQ, YM, RTY

    CME describes Micro E-mini contracts as one-tenth the size of their E-mini counterparts. The smaller multiplier reduces the dollar value of each index movement while preserving exposure to the same benchmark.

    The 10:1 Contract-Size Relationship

    The simplest way to remember the difference is:

    10 Micro contracts ≈ 1 corresponding E-mini contract in notional exposure.

    For example:

    • 10 MES ≈ 1 ES
    • 10 MNQ ≈ 1 NQ
    • 10 MYM ≈ 1 YM
    • 10 M2K ≈ 1 RTY

    This relationship is about contract size and exposure. It does not mean that trading ten Micro contracts will have exactly the same total transaction costs or execution characteristics as trading one E-mini contract.

    What Stays the Same Between Micro and E-mini Futures?

    The Micro and E-mini versions generally track the same underlying equity indexes.

    That means the comparison is not primarily about choosing a different index. It is about choosing a different contract size for that index exposure.

    For example:

    • MES and ES track the S&P 500.
    • MNQ and NQ track the Nasdaq-100.
    • MYM and YM track the Dow Jones Industrial Average.
    • M2K and RTY track the Russell 2000.

    This makes Micro futures useful when a trader wants smaller increments of exposure rather than changing the underlying market.

    What Changes?

    The most important differences are:

    • Contract multiplier
    • Dollar value per index point
    • Dollar value per tick
    • Notional exposure
    • Margin requirements
    • Position-size flexibility
    • Trading-cost impact

    Understanding these differences is more useful than simply memorizing the names “Micro” and “E-mini.”

    Micro vs E-mini Futures Contract Sizes

    The contract multiplier determines how much a one-point movement in the underlying index is worth.

    CME’s current materials show the following relationships for the major U.S. equity-index contracts.

    IndexMicro SymbolMicro $/PointE-mini SymbolE-mini $/Point
    S&P 500MES$5ES$50
    Nasdaq-100MNQ$2NQ$20
    Dow Jones Industrial AverageMYM$0.50YM$5
    Russell 2000M2K$5RTY$50

    The exact notional value changes with the index level because futures exposure is calculated from the index price multiplied by the contract multiplier.

    S&P 500: MES vs ES

    The Micro E-mini S&P 500 contract is MES, while the larger E-mini S&P 500 contract is ES.

    CME specifies:

    • MES multiplier: $5 × S&P 500 Index
    • ES multiplier: $50 × S&P 500 Index

    At an index level of 5,000:

    MES:
    5,000 × $5 = $25,000

    ES:
    5,000 × $50 = $250,000

    So one ES contract represents ten times the notional exposure of one MES contract.

    Nasdaq-100: MNQ vs NQ

    For the Nasdaq-100:

    • MNQ uses a $2 multiplier.
    • NQ uses a $20 multiplier.

    Therefore, one NQ contract represents approximately ten times the notional exposure of one MNQ contract at the same index level.

    Because the Nasdaq-100 can make relatively large index moves, understanding this multiplier is particularly important when calculating potential profit and loss.

    Dow Jones: MYM vs YM

    The Micro E-mini Dow contract is MYM, while the E-mini Dow contract is YM.

    The multipliers are:

    • MYM: $0.50 per index point
    • YM: $5 per index point

    Again, the E-mini contract is ten times the size of the Micro version.

    Russell 2000: M2K vs RTY

    For the Russell 2000:

    • M2K: $5 per index point
    • RTY: $50 per index point

    CME identifies M2K as the smaller-sized version of the Russell 2000 E-mini contract and lists a minimum tick of 0.10 index points.

    Tick Size vs Tick Value: What’s the Difference?

    These two terms are easy to confuse.

    Tick Size

    👉Tick size is the smallest price increment by which a futures contract can move.

    Tick Value

    Tick value is the amount of money represented by that minimum price movement.

    The basic calculation is:

    Tick value = Tick size × Contract multiplier

    For MES, for example:

    0.25 index points × $5 = $1.25 per tick

    A one-point move contains four 0.25-point ticks, so:

    4 × $1.25 = $5 per point

    CME’s educational material confirms that a one-tick move in Micro E-mini S&P 500 futures is $1.25 and a one-point move is $5.

    Why Tick Value Matters

    Suppose MES moves 20 points.

    The calculation is:

    20 × $5 = $100

    For ES:

    20 × $50 = $1,000

    The underlying index moved the same number of points. The difference comes from the contract multiplier.

    That is why understanding the multiplier is essential before thinking about profit, loss or risk.

    How Much Does a Price Move Affect Your P&L?

    A simple formula helps:

    P&L = Number of Contracts × Point Movement × Dollar Value Per Point

    Consider a hypothetical 10-point move in the S&P 500.

    One MES Contract

    10 points × $5 = $50

    One ES Contract

    10 points × $50 = $500

    The calculation is hypothetical and excludes commissions, exchange fees, slippage and other trading costs.

    This also works in the opposite direction. A 10-point adverse move would represent the same dollar magnitude of loss before costs.

    That’s an important point: Micro futures are smaller, but they are not risk-free.

    Micro vs E-mini Futures Margin Requirements

    Margin is one of the most misunderstood parts of futures trading.

    Futures margin is not the same thing as paying the full notional value of a contract. Instead, a trader generally posts a performance bond or margin amount to establish a futures position.

    CME explains that the margin requirement is only a fraction of the contract’s total notional value.

    However, margin figures can change.

    They may differ according to:

    • Market conditions
    • Exchange requirements
    • Broker policies
    • Account type
    • Position type
    • Intraday versus overnight requirements

    CME’s published Micro E-mini margin information explicitly notes that margin estimates are subject to change.

    For that reason, a fixed dollar margin figure should not be treated as a permanent rule.

    Initial Margin vs Maintenance Margin

    Initial margin is generally the amount required to establish a futures position.

    Maintenance margin is the minimum account equity requirement that must generally be maintained while the position remains open.

    Exact requirements should always be checked with the relevant futures broker and exchange because they can change.

    Why Margin Shouldn’t Be Confused With Risk

    A common mistake is thinking:

    “If the broker lets me open the position with $X of margin, then $X is the amount I can safely risk.”

    That’s incorrect.

    Margin determines how much capital is required to carry a position under the applicable rules. Your actual market exposure can be much larger.

    CME illustrates this distinction by showing how a Micro E-mini S&P 500 contract can provide substantial notional exposure relative to the margin required.

    Micro vs E-mini Futures: Risk and Leverage

    Micro futures reduce the dollar amount attached to each index movement, but they do not remove leverage.

    That distinction matters.

    Suppose an index moves against a position by 50 points.

    For one MES:

    50 × $5 = $250

    For one ES:

    50 × $50 = $2,500

    The Micro contract creates a smaller dollar impact for the same index movement.

    This can also allow more granular position sizing. Instead of moving directly from one large contract to no position, a trader can potentially adjust exposure using smaller contracts.

    That flexibility does not eliminate the possibility of significant losses.

    Position Size Matters More Than the Contract Name

    The important question isn’t simply:

    “Are Micro futures safer?”

    A better question is:

    “How much dollar exposure does the position create relative to the account and risk plan?”

    Ten MES contracts have approximately the same contract-size exposure as one ES contract. Therefore, simply choosing Micro futures does not automatically create lower overall exposure if the number of contracts is increased.

    Liquidity and Trading Costs

    Micro and E-mini futures can differ in liquidity and trading costs, but those differences should be considered product by product rather than assumed universally.

    Liquidity can affect:

    • Bid-ask spreads
    • Order execution
    • Slippage
    • Ability to enter or exit larger positions
    • Transaction costs

    The E-mini contracts have historically been major equity-index futures products, while Micro contracts provide smaller versions of those exposures.

    A smaller contract does not automatically mean lower total trading cost.

    For example, if ten Micro contracts are required to replicate approximately one E-mini contract’s exposure, the commission structure may make the total cost different from trading one E-mini contract.

    Always check the current fee schedule for the broker and contract being considered.

    Micro vs E-mini Futures for Position Sizing

    One of the main practical differences is granularity.

    Suppose a hypothetical strategy calls for exposure equivalent to 0.3 of an ES contract.

    A trader cannot simply buy 0.3 of one standard ES futures contract.

    But the smaller Micro contract allows exposure to be built in smaller increments.

    For example:

    • 1 MES = 0.1 ES
    • 2 MES = 0.2 ES
    • 3 MES = 0.3 ES
    • 5 MES = 0.5 ES
    • 10 MES = approximately 1 ES

    This does not mean that every position should be constructed this way. It simply demonstrates why smaller contracts can provide more flexibility in position sizing.

    Are Micro Futures Less Risky Than E-mini Futures?

    One Micro contract has less dollar exposure than one corresponding E-mini contract.

    But that does not mean Micro futures are inherently low-risk.

    Risk depends on factors such as:

    • Number of contracts
    • Price movement
    • Position size
    • Account capital
    • Stop or exit methodology
    • Volatility
    • Trading costs
    • Leverage

    For example, ten MES contracts have approximately the same contract-size exposure as one ES contract.

    So the correct distinction is:

    Smaller contract ≠ automatically safer position.

    Instead:

    Smaller contract = smaller dollar exposure per contract.

    That difference is fundamental.

    Micro vs E-mini Futures: Liquidity, Fees and Execution

    When comparing the two contract sizes, look beyond the multiplier.

    Liquidity

    Liquidity describes how easily orders can be executed without significantly affecting the market price.

    The E-mini contracts have long been important benchmark futures products. Micro contracts provide smaller-sized access to the same underlying indexes.

    Actual liquidity can vary by product, contract month and market conditions.

    Commissions

    Commission structures vary by broker.

    Trading ten Micro contracts instead of one E-mini may produce a different total commission bill depending on the broker’s pricing model.

    This is why “Micro futures are cheaper” is too broad a statement.

    The contract itself has a smaller dollar value, but total trading cost depends on how many contracts you trade and what your broker charges.

    Slippage

    Slippage occurs when an order is executed at a different price from the one expected.

    It can be affected by:

    • Market volatility
    • Liquidity
    • Order type
    • Market conditions
    • Position size

    These factors should be considered separately from contract size.

    Futures Expiration and Settlement

    Micro and E-mini equity-index futures are not perpetual contracts.

    They have expiration cycles and settlement procedures.

    CME states that Micro E-mini equity-index futures follow the same general quarterly cycle as their corresponding E-mini products, with cash settlement procedures tied to the underlying indexes.

    Before expiration, a futures position can generally be:

    • Offset
    • Rolled into another contract month
    • Held through settlement where applicable

    CME specifically notes that traders should understand their approach to expiration and rollover before the contract reaches its final trading period.

    This is another reason to check the current contract specifications rather than relying on an old article.

    Micro vs E-mini Futures: Which One Fits a Given Situation?

    There isn’t one universally correct contract size for every trader.

    Instead, the comparison can be approached through the characteristics of each contract.

    Smaller exposure

    Micro contracts provide smaller dollar exposure per contract.

    More granular sizing

    Micro contracts allow exposure to be adjusted in smaller increments.

    Larger exposure per contract

    E-mini contracts produce a larger dollar change for every index-point movement.

    Scaling

    Micro contracts can provide more flexibility when building or reducing exposure in smaller increments.

    Transaction costs

    The number of contracts and broker fee structure should be considered before assuming one size is cheaper.

    The key is to compare exposure, position size, costs and risk together, rather than focusing on margin alone.

    Common Mistakes When Comparing Micro and E-mini Futures

    Mistake 1: Confusing Margin With Contract Value

    Margin is not the same as notional exposure.

    A relatively small margin requirement can control a much larger futures position.

    Mistake 2: Ignoring the Contract Multiplier

    Two contracts can track the same index but have very different dollar values per point.

    Always check the multiplier.

    Mistake 3: Assuming Ten Micros Cost the Same as One E-mini

    Ten Micro contracts approximate one E-mini in contract-size exposure, but fees and execution costs can differ.

    Mistake 4: Assuming Micro Means Low Risk

    A smaller contract reduces the dollar value per contract. It does not remove leverage or market risk.

    Mistake 5: Using Outdated Margin Figures

    Margin requirements change.

    CME’s own historical margin tables explicitly state that published estimates are subject to change.

    Mistake 6: Forgetting Expiration

    Futures have contract months and settlement procedures. A futures position should not be treated like a perpetual spot position.

    Micro vs E-mini Futures FAQs

    How many Micro futures equal one E-mini?

    For the major Micro E-mini equity-index contracts, 10 Micro contracts correspond approximately to one E-mini contract in contract size. For example, 10 MES contracts have approximately the same notional contract-size exposure as one ES contract.

    What is the difference between MES and ES?

    MES is the Micro E-mini S&P 500 futures contract, while ES is the larger E-mini S&P 500 futures contract. MES uses a $5 multiplier, while ES uses a $50 multiplier.

    What is the difference between MNQ and NQ?

    MNQ is the Micro E-mini Nasdaq-100 futures contract and NQ is the larger E-mini Nasdaq-100 contract. MNQ uses a $2 multiplier while NQ uses a $20 multiplier.

    Are Micro futures the same market as E-mini futures?

    The corresponding Micro and E-mini contracts provide exposure to the same underlying equity-index benchmark, but they have different contract multipliers and therefore different dollar exposure per point.

    Are Micro futures cheaper to trade?

    Not necessarily. A single Micro contract has smaller exposure, but traders may need multiple Micro contracts to replicate one E-mini contract. Total commissions and other trading costs depend on the number of contracts and the broker’s pricing.

    Are Micro futures less risky?

    One Micro contract has lower dollar exposure than one corresponding E-mini contract. However, total risk depends on the number of contracts, price movement, leverage, account size and other factors.

    What is the tick value of MES?

    MES has a minimum tick of 0.25 index points and a $5 multiplier, producing a tick value of $1.25.

    What is the tick value of ES?

    ES also moves in 0.25-point increments, but its $50 multiplier means each minimum tick is worth $12.50.

    What are the Micro futures symbols?

    CME identifies the major Micro E-mini equity-index symbols as:

    • MES — S&P 500
    • MNQ — Nasdaq-100
    • MYM — Dow Jones Industrial Average
    • M2K — Russell 2000

    Can Micro futures be used for smaller position sizing?

    Yes. Their smaller contract multipliers allow exposure to be adjusted in smaller increments than with the corresponding E-mini contracts. That can provide greater flexibility when managing position size.

    Do Micro and E-mini futures expire?

    Yes. Equity-index futures have contract months and expiration/settlement procedures. CME provides current contract calendars and settlement information, so traders should verify the applicable contract specifications before expiration.

    Key Takeaways

    The main difference between Micro and E-mini futures is contract size.

    Micro E-mini contracts are generally one-tenth the size of their corresponding E-mini contracts. That means:

    • MES is 1/10 the contract size of ES.
    • MNQ is 1/10 the contract size of NQ.
    • MYM is 1/10 the contract size of YM.
    • M2K is 1/10 the contract size of RTY.

    The smaller contract size produces a smaller dollar value per index point and allows more granular position sizing.

    But Micro futures still involve leverage, market risk, fees and expiration. A smaller contract should therefore be understood as a smaller unit of exposure, not as a risk-free or automatically safer trading product.

    For more market-focused educational resources, you can explore the OfferBin blog, while OfferBin.io provides live market data and token conversion tools for supported crypto assets. OfferBin itself is a market-data reference and converter, not a futures broker or trading platform.

  • What Is a Value Trade? How Value Trading Works

    What Is a Value Trade? How Value Trading Works

    A value trade is based on a simple idea: a security may be worth more than its current market price.

    Instead of focusing only on where a stock’s price is moving, value-oriented investors examine the underlying business, its earnings, assets, cash flow, growth prospects, and other fundamentals. They then estimate what the security may be worth and compare that estimate with its market price.

    If the estimated value is meaningfully higher than the market price, the security may appear undervalued. But that does not automatically make it a good investment. Valuation is an estimate, and the market may have a good reason for pricing a company cheaply.

    The distinction matters because cheap is not always the same as undervalued.

    This guide explains what a value trade means, how value trading works, which valuation metrics investors commonly examine, how value trading differs from value investing, and how to recognize potential value traps.

    Key takeaway: Value trading uses fundamental analysis and valuation to look for securities whose market prices appear lower than their estimated underlying value. The central challenge is determining whether the valuation is correct and whether the market will eventually recognize that value.

    What Is a Value Trade?

    A value trade is a market position based on the belief that an asset’s current price does not fully reflect its underlying or intrinsic value.

    For stocks, that analysis normally starts with the company rather than the chart. An investor may examine:

    • Revenue and earnings
    • Free cash flow
    • Assets and liabilities
    • Debt levels
    • Profit margins
    • Competitive position
    • Growth prospects
    • Dividend payments
    • Industry conditions
    • Management
    • Valuation multiples

    The investor then compares those fundamentals with the company’s current market valuation.

    The underlying concept is closely related to value investing. FINRA describes value investing as using fundamental analysis to identify securities that appear to trade below their intrinsic worth or below comparable securities.

    However, the phrase “value trade” is less standardized than “value investing.” Depending on context, it can describe a specific value-oriented position, a trading thesis based on valuation, or a broader value-investing approach.

    That makes it important to define the strategy before applying it.

    How Does Value Trading Work?

    Value trading generally follows a process rather than relying on one financial ratio.

    Find Potentially Undervalued Stocks

    The first step is to identify companies whose valuation appears low relative to their fundamentals, historical valuation, or comparable companies.

    A low P/E ratio, for example, can attract attention. But a low multiple by itself does not prove that a stock is undervalued.

    The company could have declining earnings, excessive debt, weak competitive advantages, or an industry facing structural problems.

    Analyze the Company’s Fundamentals

    Fundamental analysis examines the economic and financial characteristics of a business.

    CFA Institute distinguishes fundamental analysis from technical analysis by noting that fundamental analysis uses information about the economy, industry, and company to estimate a security’s value and compare that estimate with its market price.

    A basic fundamental review might examine:

    • Revenue growth
    • Earnings quality
    • Free cash flow
    • Profitability
    • Debt
    • Return on equity
    • Capital requirements
    • Competitive advantages
    • Industry trends

    Estimate Intrinsic or Fair Value

    The next step is estimating what the business may be worth.

    There is no single universal formula for intrinsic value. Analysts can use different approaches, including:

    • Discounted cash flow models
    • Dividend discount models
    • Price multiples
    • Enterprise-value multiples
    • Asset-based valuation
    • Comparable-company analysis

    CFA Institute identifies present-value, multiplier, and asset-based approaches among the major categories of equity valuation models.

    Because different assumptions can produce different results, intrinsic value should be treated as an estimate rather than an objective number.

    Compare Market Price With Estimated Value

    Suppose a hypothetical company trades at $60 per share while an analyst’s valuation model estimates a value of $80.

    The difference does not mean the stock will automatically rise to $80.

    Instead, it creates a valuation question:

    Why is the market pricing the company at $60?

    The answer could reveal either an opportunity or a problem.

    Look for a Reason the Valuation Could Change

    A value thesis often needs some reason for the market’s perception to change.

    Potential catalysts might include:

    • Improving earnings
    • Debt reduction
    • Higher free cash flow
    • Successful restructuring
    • New products
    • Asset sales
    • Industry recovery
    • Improved profitability
    • Management changes

    A company can remain apparently undervalued for a long time, so identifying the investment thesis is an important part of the analysis.


    Value Trading vs. Value Investing

    The terms value trading and value investing overlap, but they are not necessarily identical.

    Value TradingValue Investing
    Can describe a valuation-based market positionUsually describes a broader investment philosophy
    May involve a defined thesis or catalystOften emphasizes longer-term ownership
    Can focus on price/value discrepanciesUsually focuses on business fundamentals and intrinsic value
    Time horizon can varyOften associated with a longer horizon
    May use valuation plus catalystsTypically emphasizes fundamental valuation
    Can be more tacticalGenerally more thesis-driven

    The boundary is not fixed. Someone using valuation to identify a mispriced stock could reasonably describe the approach as value trading, value investing, or both.

    The important point is the method used to establish value, not the label.


    How to Find Potentially Undervalued Stocks

    Finding an undervalued stock requires more than searching for companies with low prices.

    A stock trading at $10 can be more expensive relative to its fundamentals than a stock trading at $200.

    The analysis should focus on valuation relative to the company’s underlying financial characteristics.

    Price-to-Earnings Ratio

    The price-to-earnings (P/E) ratio compares a company’s share price with its earnings per share.

    A simplified formula is:

    P/E = Share Price ÷ Earnings Per Share

    Investors often compare P/E ratios with:

    • Industry peers
    • Historical company valuations
    • Expected earnings growth
    • Profitability
    • Business quality

    A low P/E can indicate a potentially attractive valuation, but it can also reflect weak growth expectations or deteriorating fundamentals.

    CFA Institute notes that price multiples are widely used valuation tools and that P/E relates market price to fundamental measures such as earnings.

    Price-to-Book Ratio

    The price-to-book (P/B) ratio compares a company’s market value with its book value.

    It can be particularly useful when analyzing businesses with substantial tangible assets, although its usefulness varies significantly between industries.

    A lower P/B does not automatically mean a company is undervalued. Investors should consider why the market assigns that valuation.

    Free Cash Flow

    Free cash flow can provide another perspective on the economic resources generated by a business.

    CFA Institute describes free-cash-flow valuation as a form of discounted cash flow analysis in which expected future cash flows are used to estimate intrinsic value.

    When examining free cash flow, investors may ask:

    • Is cash flow consistently positive?
    • Is it growing?
    • How much capital does the business need?
    • Is reported profit supported by cash generation?
    • How much debt does the company carry?

    Dividend Yield

    Dividend yield measures annual dividends relative to the stock price.

    A simplified formula is:

    Dividend Yield = Annual Dividend Per Share ÷ Share Price × 100

    A high dividend yield can attract value-oriented investors, but a high yield can also result from a falling stock price or an unsustainable dividend.

    The dividend therefore needs to be considered alongside earnings, free cash flow, payout ratios, and the company’s financial position.

    Earnings Growth

    Value analysis should not ignore growth.

    A company with a low valuation and steadily improving earnings may have a different risk profile from a company with a low valuation because its business is deteriorating.

    The quality and sustainability of earnings therefore matter as much as the headline valuation multiple.

    Balance Sheet Strength

    Debt can significantly change a value thesis.

    Two companies can have similar P/E ratios while carrying very different levels of debt.

    Useful questions include:

    • How much debt does the company have?
    • Can it comfortably service that debt?
    • Are interest costs rising?
    • Does the company have sufficient liquidity?
    • Is management reducing or increasing leverage?

    Common Valuation Metrics at a Glance

    MetricWhat It MeasuresWhy Investors Use ItImportant Limitation
    P/EPrice relative to earningsCompares valuation with earningsLess useful when earnings are negative or distorted
    P/BPrice relative to book valueUseful for certain asset-heavy businessesBook value may not capture intangible assets well
    P/FCFPrice relative to free cash flowFocuses on cash generationFree cash flow can fluctuate
    Dividend YieldDividend relative to share priceHelps assess income componentHigh yield can signal risk
    EV/EBITDAEnterprise value relative to EBITDAUseful for comparing operating businessesEBITDA is not the same as free cash flow
    P/SPrice relative to salesUseful when earnings are temporarily weakSales do not necessarily equal profitability

    No single metric should normally be treated as a complete valuation model.


    Market Price vs. Intrinsic Value

    Market price is the price at which a security currently trades.

    Intrinsic value is an estimate of what the security may be worth based on its underlying economic characteristics.

    FINRA describes intrinsic value as an estimate of what an investment is fundamentally worth, based on factors such as earnings, assets, cash flow, growth prospects, and interest rates. It also notes that intrinsic value is subjective because different analysts can evaluate those factors differently.

    This creates three broad valuation scenarios:

    SituationRelationship
    Potentially undervaluedEstimated value > market price
    Potentially fairly valuedEstimated value ≈ market price
    Potentially overvaluedEstimated value < market price

    These are analytical classifications, not guarantees about future prices.

    CFA Institute similarly explains that when estimated intrinsic value exceeds market price, an analyst may infer that a security is undervalued, while emphasizing the uncertainty involved in valuation.


    What Is a Margin of Safety?

    A margin of safety is the gap between an investor’s estimated value and the price paid.

    The idea is straightforward.

    If your estimated intrinsic value is $100 and the market price is $95, the difference is relatively small.

    If the same estimate is $100 and the market price is $60, there is a much larger gap.

    But the size of that gap does not automatically tell you how safe the investment is.

    If your valuation estimate is wrong, the apparent margin of safety may disappear.

    That is why valuation assumptions deserve as much attention as the final number.


    Why a Stock Can Look Cheap but Still Be Expensive

    One of the biggest mistakes in value trading is assuming that a low valuation multiple automatically means a bargain.

    Consider a hypothetical company:

    • Current price: $20
    • P/E: 7
    • Debt: High
    • Revenue: Declining
    • Earnings: Declining
    • Industry: Shrinking

    At first glance, a P/E of 7 may appear attractive.

    But if earnings continue falling, the “cheap” valuation could be justified.

    Now consider another hypothetical company:

    • Current price: $50
    • P/E: 18
    • Debt: Moderate
    • Revenue: Growing
    • Earnings: Growing
    • Free cash flow: Strong
    • Competitive position: Improving

    The second company has a higher P/E but could potentially offer a stronger fundamental case.

    Valuation is about the relationship between price, fundamentals, risk, and future expectations—not simply finding the lowest number.


    Value Stocks vs. Growth Stocks

    Value and growth are often presented as opposing investment styles, although real companies can have characteristics of both.

    Value-Oriented ApproachGrowth-Oriented Approach
    Focuses heavily on valuationFocuses heavily on future growth
    Often looks for lower valuation multiplesMay accept higher valuation multiples
    Can favor established businessesOften favors businesses with strong expansion potential
    Emphasizes current fundamentalsPlaces greater weight on future earnings potential
    May seek a discount to estimated valueMay accept premium valuations for expected growth

    Neither category guarantees better performance.

    Market conditions can favor different styles at different times, and a company can move from one category to another.


    What Is a Value Trap?

    A value trap occurs when a security appears cheap but remains cheap—or falls further—because the underlying business is weaker than the valuation suggests.

    For example, a stock could have:

    • A low P/E
    • A low P/B
    • A high dividend yield

    and still be a poor value if:

    • Earnings are structurally declining
    • Debt is becoming unmanageable
    • The industry is shrinking
    • Competitive advantages are disappearing
    • Cash flow is deteriorating
    • Management is destroying shareholder value

    SEC-filed fund disclosures specifically warn that a security judged to be undervalued may actually be appropriately priced and that the market may fail to recognize perceived intrinsic value for a long period.

    This is one reason value analysis requires more than screening for low ratios.


    A Simple Value Trade Example

    Imagine a fictional company called Northstar Manufacturing.

    Its shares trade at $40.

    After reviewing the business, an analyst estimates a possible intrinsic value of $60 based on earnings, cash flow, comparable companies, and future assumptions.

    At first, the numbers suggest a discount.

    But the analyst then investigates why the market price is $40.

    Scenario A: Temporary Problem

    Northstar recently experienced a temporary supply-chain disruption.

    The business remains profitable, debt is manageable, and cash flow is expected to recover.

    The lower share price may have a temporary explanation.

    Scenario B: Structural Problem

    Northstar’s main products are becoming obsolete.

    Revenue is declining, debt is rising, and management has no credible plan to reverse the trend.

    The $40 market price may not represent an overlooked bargain.

    It may reflect the market’s expectations about the company’s future.

    This illustrates an important principle:

    A value trade is not simply a difference between two numbers. The reason for that difference matters.


    A Practical Value Trading Checklist

    Before treating a stock as a potential value opportunity, investors can ask:

    Valuation

    • Is the company inexpensive relative to relevant peers?
    • Is the valuation attractive compared with its own history?
    • Which valuation method is most appropriate?

    Fundamentals

    • Are revenue and earnings stable or improving?
    • Is free cash flow healthy?
    • Is the balance sheet strong?
    • Is debt manageable?

    Business Quality

    • Does the company have a sustainable competitive advantage?
    • Is its industry healthy?
    • Is management allocating capital effectively?

    Risk

    • What could invalidate the valuation?
    • Could earnings fall further?
    • Could debt become a problem?
    • Is the business facing structural disruption?

    Thesis

    • Why does the market appear to be mispricing the company?
    • What could cause the valuation gap to narrow?
    • How long could that process take?

    Valuation Uncertainty

    • What assumptions are driving the estimated value?
    • What happens if those assumptions are wrong?
    • Would the thesis still make sense under a less optimistic scenario?

    This checklist is an educational framework, not a personalized investment recommendation.


    Common Value Trading Mistakes

    Relying on One Ratio

    A low P/E does not tell you everything about a business.

    Use multiple pieces of evidence rather than treating one ratio as the answer.

    Confusing a Falling Price With Value

    A stock becoming cheaper does not necessarily mean it is becoming more attractive.

    The underlying business may also be deteriorating.

    Ignoring Debt

    A business can look inexpensive on an earnings basis while carrying significant financial risk.

    Ignoring Industry Changes

    A company operating in a declining industry may deserve a lower valuation than it received in the past.

    Assuming Intrinsic Value Is Precise

    Intrinsic value is an estimate based on assumptions.

    Different models and assumptions can produce different results. CFA Institute notes that analysts often use multiple valuation models because inputs and applicability can vary.

    Forgetting the Time Horizon

    Even if an asset is genuinely undervalued, the market may not recognize that difference quickly.

    SEC disclosures on value-style investing explicitly identify the possibility that perceived intrinsic value may not be recognized for extended periods.


    How Value Trading Differs From Technical Trading

    Value-oriented analysis and technical analysis approach the market from different starting points.

    Value/Fundamental Analysis

    Focuses on:

    • Financial statements
    • Earnings
    • Cash flow
    • Assets
    • Debt
    • Business quality
    • Industry conditions
    • Valuation

    Technical Analysis

    Focuses more heavily on:

    • Price
    • Volume
    • Trends
    • Support and resistance
    • Chart patterns
    • Market momentum

    CFA Institute describes fundamental analysis as using economic, industry, and company information to estimate value, while technical analysis uses market information such as price and trading volume.

    Some market participants use both approaches, but they answer different questions.


    Can Value Trading Apply to Cryptocurrency?

    This is where traditional stock valuation and crypto analysis need to be separated.

    A public company generally has financial statements, earnings, assets, liabilities, cash flow, and potentially dividends. Many cryptocurrencies do not have these same characteristics.

    For example, a cryptocurrency may be evaluated using factors such as:

    • Network activity
    • Token supply
    • Token utility
    • Adoption
    • Liquidity
    • Developer activity
    • Market structure
    • Network economics
    • Competition
    • Regulatory conditions

    That means a traditional stock metric such as P/E cannot simply be transferred to Bitcoin or another token.

    OfferBin’s educational content explains that cryptocurrencies differ from traditional stocks because cryptoassets generally do not represent ownership of a company with conventional earnings and dividends.

    For readers interested in the broader relationship between crypto prices and market conditions, OfferBin’s guide on Bitcoin price and valuation factors provides additional context.

    If you’re researching crypto as a separate asset class, you can also explore OfferBin’s guide to crypto as an investment.


    How to Think About Value Trading in Practice

    A useful way to think about value trading is as a chain of questions:

    What does the asset cost?

    What might it be worth?

    How did I estimate that value?

    Why does the market price differ?

    What could make my valuation wrong?

    What could cause the market’s view to change?

    How much uncertainty is involved?

    This framework helps prevent valuation from becoming nothing more than a search for cheap-looking numbers.


    Frequently Asked Questions About Value Trading

    What is a value trade?

    A value trade is a market position based on the idea that an asset’s current market price may be below its estimated underlying or intrinsic value. For stocks, the analysis commonly involves financial statements, valuation ratios, cash flow, earnings, assets, growth prospects, and industry conditions.

    Is value trading the same as value investing?

    They overlap but are not necessarily identical. Value investing is generally a broader investment philosophy centered on buying securities that appear undervalued relative to intrinsic value. Value trading can describe a more specific position or strategy based on a perceived price-value discrepancy.

    How do you find undervalued stocks?

    Investors commonly examine valuation measures such as P/E, P/B, P/FCF, dividend yield and enterprise-value multiples alongside earnings, cash flow, debt, growth, industry conditions and business quality. No single metric proves that a stock is undervalued.

    What is intrinsic value?

    Intrinsic value is an estimate of what an asset is fundamentally worth based on its economic characteristics and expected future benefits. Because the calculation depends on assumptions, different analysts can reach different estimates.

    What is a value trap?

    A value trap is a security that appears inexpensive but remains inexpensive or declines because its underlying business is weaker than expected. A low valuation multiple alone does not eliminate this risk.

    Which ratios are useful for value investing?

    Commonly used measures include P/E, P/B, P/FCF, P/S, EV/EBITDA and dividend yield. Their usefulness depends on the company, industry and financial characteristics being analyzed.

    Is value trading short-term or long-term?

    The time horizon can vary. Value investing is often associated with longer-term holding periods because it may take time for a perceived valuation gap to close. A value-based trade can also have a shorter defined thesis or catalyst.

    What is the difference between market price and fair value?

    Market price is the current trading price. Fair value or intrinsic value is an estimate of what the asset may be worth based on an analytical model or valuation framework.

    Can a stock be cheap and still be overvalued?

    Yes. A stock can trade at a low valuation multiple because investors expect its earnings, cash flow or business prospects to deteriorate. A low price or low ratio does not automatically establish undervaluation.

    Does value trading guarantee profits?

    No. Valuation is uncertain, and the market can disagree with an investor’s estimate for a long time. A security that appears undervalued can fall further or fail to reach the estimated value.


    Final Thoughts on Value Trading

    The core idea behind a value trade is straightforward: compare what an asset costs with what you believe it may be worth.

    The difficult part is everything that comes after that comparison.

    A useful value analysis requires more than finding a low P/E ratio or a stock trading near its historical low. You need to understand the business, assess its financial position, estimate value using appropriate methods, examine the reasons behind the current price, and consider what could make your assumptions wrong.

    The most important distinction is between cheap and undervalued.

    A cheap security can be a genuine opportunity, but it can also be a value trap. Likewise, a company with a higher valuation can sometimes have stronger fundamentals and growth prospects that justify its price.

    For crypto markets, the analysis changes again because many digital assets do not have the same earnings, book value, dividends, or corporate cash flows as publicly traded companies.

    If you want to continue exploring market and digital-asset concepts, OfferBin provides educational resources and crypto market tools designed to help users research prices and digital assets.

    The goal of value analysis is therefore not simply to find the lowest price. It is to understand the relationship between price, value, fundamentals, expectations, and risk before drawing a conclusion.