Day: September 16, 2026

  • Student Loan Plans UK: Plan 1, 2, 4, 5 & Postgraduate Explained

    Student Loan Plans UK: Plan 1, 2, 4, 5 & Postgraduate Explained

    If you have a UK student loan, the amount you repay depends mainly on which student loan plan you have and how much you earn.

    For the 2026/27 tax year, there are five main undergraduate repayment plans — Plan 1, Plan 2, Plan 4 and Plan 5 — plus the separate Postgraduate Loan repayment plan. Plans have different income thresholds, interest rules and write-off periods.

    The most important point is that your student loan balance does not determine how much you repay each year. Repayments are based on your income above the threshold for your plan.

    Student Loan Plans at a Glance

    Here are the main repayment thresholds and rates for 2026/27:

    Student loan plan2026/27 annual thresholdMonthly thresholdRepayment rate
    Plan 1£26,900£2,2419%
    Plan 2£29,385£2,4489%
    Plan 4£33,795£2,8169%
    Plan 5£25,000£2,0839%
    Postgraduate Loan£21,000£1,7506%

    These are the official 2026/27 thresholds. Your repayment is calculated on the portion of income above the relevant threshold, not on your entire salary.

    For example, if you are on Plan 2 and earn £40,000:

    • Annual income: £40,000
    • Plan 2 threshold: £29,385
    • Income above threshold: £10,615
    • Repayment: 9% × £10,615
    • Annual repayment: £955.35
    • Average monthly equivalent: about £79.61

    Your actual deductions can vary depending on how you are paid and how payroll calculations are applied.

    What Are Student Loan Plans?

    Student loan plans are different sets of repayment rules that determine when you repay your loan, how much you repay and how interest is applied.

    Your plan is generally determined by factors such as:

    • Where you studied
    • When you started your course
    • Whether the loan was undergraduate or postgraduate
    • Which UK student-finance system provided the loan

    The main UK income-contingent plans are:

    • Plan 1
    • Plan 2
    • Plan 4
    • Plan 5
    • Postgraduate Loan

    Plan 1 generally covers older loans, including borrowers who started certain courses before September 2012 and borrowers in Northern Ireland. .Plan 4 applies to eligible Scottish borrowers. Plan 2 covers many English and Welsh undergraduate borrowers who started under the previous system, while Plan 5 applies to new English undergraduate borrowers from August 2023.

    👉Plan 1 Student Loans

    Plan 1 applies mainly to borrowers who started eligible undergraduate courses before September 2012. It also covers certain borrowers in Northern Ireland.

    For 2026/27:

    • Threshold: £26,900 a year
    • Monthly threshold: about £2,241
    • Repayment rate: 9% above the threshold
    • Current interest rate: 4.1%

    The Plan 1 interest rate is subject to the applicable rules and can be linked to RPI or the Bank of England base rate plus 1%, whichever is lower under the relevant rules. For 1 September 2026 to 31 August 2027, the maximum applicable Plan 1 rate is 4.1%.

    How Plan 1 repayment works

    Suppose you earn £33,000 a year.

    Your income above the annual threshold is:

    £33,000 − £26,900 = £6,100

    You repay 9% of that amount:

    £6,100 × 9% = £549 a year

    That is approximately £45.75 a month when expressed as an annual average.

    Plan 2 Student Loans

    Plan 2 is commonly associated with English undergraduate courses that started between September 2012 and July 2023 and Welsh undergraduate borrowers who started from September 2012.

    For 2026/27:

    • Threshold: £29,385 a year
    • Monthly threshold: about £2,448
    • Repayment rate: 9% above the threshold
    • Interest can vary according to income
    • Current Plan 2 interest is subject to a 6% cap for the 2026/27 period

    GOV.UK states that after study, Plan 2 interest is normally RPI plus up to 3%, depending on income, with the current 6% cap applying during the relevant 2026/27 period.

    Plan 2 repayment example

    Imagine your annual salary is £50,000.

    Income above the threshold:

    £50,000 − £29,385 = £20,615

    Repayment:

    £20,615 × 9% = £1,855.35 a year

    That is approximately £154.61 per month when divided by 12.

    Notice that the calculation is based on the £20,615 above the threshold, not the full £50,000 salary.

    Plan 4 Student Loans

    Plan 4 applies primarily to eligible Scottish student-loan borrowers.

    For 2026/27:

    • Threshold: £33,795 a year
    • Monthly threshold: about £2,816
    • Repayment rate: 9% above the threshold
    • Current interest rate: 4.1%

    Plan 4 example

    If you earn £36,000:

    £36,000 − £33,795 = £2,205

    Your annual repayment is:

    £2,205 × 9% = £198.45

    That works out at about £16.54 per month on an annual-average basis.

    Plan 5 Student Loans

    Plan 5 is the newer undergraduate repayment plan for eligible English students who started courses from August 2023.

    For 2026/27:

    • Threshold: £25,000 a year
    • Monthly threshold: about £2,083
    • Repayment rate: 9%
    • Interest is normally linked to RPI
    • Repayment term: 40 years

    The government introduced Plan 5 for new English undergraduate borrowers from the 2023/24 academic year.

    Plan 5 example

    If you earn £30,000:

    £30,000 − £25,000 = £5,000

    Your annual repayment would be:

    £5,000 × 9% = £450

    That is approximately £37.50 per month on an annual-average basis.

    Postgraduate Loan Repayment Plan

    A Postgraduate Loan is separate from the undergraduate plans.

    For 2026/27:

    • Threshold: £21,000 a year
    • Monthly threshold: £1,750
    • Repayment rate: 6%
    • Write-off period for eligible England and Wales postgraduate loans: 30 years

    Interest is normally RPI plus 3%, with a 6% cap applying between 1 September 2026 and 31 August 2027.

    Postgraduate Loan example

    Suppose you earn £30,000.

    Income above the £21,000 threshold:

    £30,000 − £21,000 = £9,000

    Repayment:

    £9,000 × 6% = £540 a year

    That is equivalent to approximately £45 per month.

    Which Student Loan Plan Am I On?

    If you are unsure which plan you have, do not guess based only on your current salary.

    Your plan can depend on your:

    1. Country or region of study
    2. Course start date
    3. Type of course
    4. Type of student finance
    5. Previous loans

    A useful starting point is your Student Loans Company information and your payroll records.

    Your employer’s payroll process can also use your student-loan plan information when calculating deductions. HMRC’s 2026/27 payroll guidance specifically lists Plan 1, Plan 2, Plan 4, Plan 5 and Postgraduate Loans.

    If you have paperwork that uses different terminology, look for the plan type rather than assuming that every student loan follows the same repayment rules.

    How Do Student Loan Repayments Work?

    The basic calculation is straightforward:

    Repayment = (Income − Plan Threshold) × Repayment Rate

    But only apply the formula when your income is above the applicable threshold.

    For example, a Plan 2 borrower earning £40,000 in 2026/27 would have:

    £40,000 − £29,385 = £10,615

    Then:

    £10,615 × 9% = £955.35

    So the annual repayment is approximately £955.35.

    Your outstanding student loan balance does not change that annual repayment calculation. The balance and interest affect how long the loan may remain outstanding, but the repayment amount is primarily linked to income.

    What Happens If Your Income Changes?

    Student loan repayments are income-contingent, so your deductions can change when your earnings change.

    Income can include things such as:

    • Salary
    • Bonuses
    • Overtime
    • Other earnings included under the applicable repayment rules

    If your income temporarily rises above the threshold, you may make repayments during that period.

    GOV.UK also explains that if your annual income ends up below your plan’s annual threshold, you may be able to request a refund of certain repayments made during the year.

    Student Loan Interest Rates in 2026/27

    Interest is separate from your repayment calculation.

    This distinction is important:

    Your repayment is based on income.

    Interest affects your outstanding balance.

    For 2026/27, GOV.UK lists:

    PlanCurrent 2026/27 interest position
    Plan 14.1% maximum applicable rate for 1 Sept 2026–31 Aug 2027
    Plan 2Variable according to income, with a 6% cap during the relevant 2026/27 period
    Plan 44.1%
    Plan 5Normally RPI
    Postgraduate LoanNormally RPI + 3%, with a 6% cap during the relevant 2026/27 period

    Interest can continue to be applied even when you are below the repayment threshold. This is why the amount shown on your student-loan statement can behave differently from the amount being deducted from your payslip.

    When Are Student Loans Written Off?

    A student loan is not necessarily repaid like a conventional personal loan.

    If you do not repay the full balance within the applicable repayment period, the remaining amount can be cancelled under the rules for your plan.

    The timing depends on your plan and circumstances.

    PlanGeneral cancellation period
    Older Plan 1 loansDepends on when the loan was taken out; some older loans have age-based rules
    Plan 1 loans taken out from Sept 2006 to before Sept 201225 years after the April when repayments were first due
    Plan 230 years after the April when repayments were first due
    Plan 540 years after the April when repayments were first due
    Postgraduate Loan30 years after the April when repayments were first due

    The exact cancellation rules can depend on the type and date of the loan, so use your official loan information rather than assuming a single write-off period applies to everyone.

    Plan 1 vs Plan 2 vs Plan 4 vs Plan 5

    The biggest differences are the threshold, repayment rate, interest rules and repayment term.

    FeaturePlan 1Plan 2Plan 4Plan 5
    2026/27 threshold£26,900£29,385£33,795£25,000
    Repayment rate9%9%9%9%
    Main associationOlder UK loansMany 2012–2023 English/Welsh borrowersScottish borrowersNewer English undergraduate borrowers
    Interest4.1% current rateVariable, capped at 6% currently4.1%Normally RPI
    General repayment termDepends on loan date30 yearsDepends on loan date/rules40 years

    The table is a simplified overview. Your exact eligibility and terms depend on the loan you actually took out.

    What If You Have More Than One Student Loan?

    Some borrowers have more than one type of student loan.

    For example, you may have an undergraduate loan and a separate Postgraduate Loan.

    In that situation, deductions can apply under the rules for both loan types.

    For 2026/27, undergraduate Plan 1, 2, 4 and 5 repayments use a 9% rate above the relevant threshold, while the Postgraduate Loan uses a 6% rate above its threshold.

    GOV.UK provides specific rules for borrowers with multiple plan types, including how repayments are allocated when someone has more than one undergraduate plan.

    This is one reason a simple “student loan percentage” does not always tell the whole story.

    How Much Will You Repay on Different Salaries?

    Here are simplified annual examples for 2026/27.

    Annual incomePlan 1Plan 2Plan 4Plan 5Postgraduate Loan
    £25,000£0£0£0£0£240
    £30,000£279£55£0£450£540
    £40,000£1,179£955£559£1,350£1,140
    £50,000£2,079£1,855£1,459£2,250£1,740

    These examples use the annual thresholds and repayment percentages published for 2026/27. Actual payroll deductions can differ slightly because PAYE uses pay-period thresholds and payroll calculations.

    Do Student Loans Affect Your Credit Score?

    Student loan repayments are not treated like ordinary commercial borrowing for UK credit reporting.

    GOV.UK states that student loans do not appear on credit reports and do not affect your credit score. However, lenders may consider your student-loan repayment when assessing affordability for other borrowing, such as a mortgage.

    So a student loan can matter to your disposable income and affordability assessment even though it is not reported in the same way as a conventional credit balance.

    Can You Pay Off a Student Loan Early?

    Yes. GOV.UK states that there is no penalty for making voluntary early repayments.

    Whether making additional payments is appropriate depends on your circumstances, including:

    • Your plan
    • Your income
    • Your outstanding balance
    • Expected future earnings
    • Interest rates
    • How long you expect to remain in repayment
    • Your other financial priorities

    Because these factors vary substantially between borrowers, there is no single repayment strategy that applies to everyone.

    Student Loan Plans for People Living Overseas

    Moving outside the UK does not automatically remove your repayment obligations.

    The Student Loans Company publishes country-specific overseas earnings thresholds and repayment information. These can differ from the UK thresholds.

    For example, GOV.UK publishes separate 2026/27 overseas thresholds for Plan 1, Plan 2, Plan 5 and Postgraduate Loans.

    If you live abroad, check the official SLC information for the country where you live rather than applying the UK PAYE threshold directly.

    Common Student Loan Plan Questions

    What is the student loan threshold for 2026/27?

    For 2026/27, the annual thresholds are £26,900 for Plan 1, £29,385 for Plan 2, £33,795 for Plan 4, £25,000 for Plan 5 and £21,000 for Postgraduate Loans.

    What percentage do I repay?

    Plans 1, 2, 4 and 5 use a 9% repayment rate on income above the relevant threshold. Postgraduate Loans use 6%.

    Is Plan 5 the same as Plan 2?

    No. Plan 5 has a lower 2026/27 repayment threshold of £25,000 compared with £29,385 for Plan 2. Plan 5 also has a 40-year repayment term and normally applies RPI-only interest, while Plan 2 has different interest rules and a 30-year repayment period.

    What student loan plan am I on?

    Your plan normally depends on where and when you studied and the type of loan you received. Your Student Loans Company information and repayment records are the safest places to confirm your plan.

    Do I repay my student loan if I earn below the threshold?

    Normally, you do not make income-based repayments when your earnings are below the applicable threshold. However, interest can still be applied to your outstanding balance.

    Does my student loan balance determine my monthly payment?

    No. For income-contingent repayments, the amount you owe does not determine the amount you repay each year. Your income and repayment-plan threshold are the key factors.

    When does a student loan get written off?

    The period depends on the plan. Plan 2 loans generally have a 30-year cancellation period, Plan 5 has a 40-year period, and Postgraduate Loans in England and Wales generally have a 30-year period. Some older Plan 1 loans have different rules.

    Can I have an undergraduate loan and a Postgraduate Loan?

    Yes. A borrower can have an undergraduate student loan and a separate Postgraduate Loan, with repayments calculated under the relevant rules for each type.

    Key Takeaways

    Student loan plans can look complicated because the rules depend on when and where you studied, but the basic repayment system is relatively simple.

    For 2026/27:

    • Plan 1: £26,900 threshold and 9% repayment
    • Plan 2: £29,385 threshold and 9% repayment
    • Plan 4: £33,795 threshold and 9% repayment
    • Plan 5: £25,000 threshold and 9% repayment
    • Postgraduate Loan: £21,000 threshold and 6% repayment

    The amount you owe is not what determines your annual income-based repayment. Instead, you generally repay a percentage of income above your plan’s threshold.

    Because thresholds, interest rates and repayment rules can change, check the latest official information before making decisions about your student loan.

    For additional online guides and resources, you can also explore Offerbin.io.
    Official Sources

  • How to Identify Uptrends & Downtrends: HH, HL, LH & LL

    How to Identify Uptrends & Downtrends: HH, HL, LH & LL

    Knowing how to identify uptrends and downtrends is one of the most useful skills in technical analysis. Instead of trying to predict every price move, you can study the sequence of swing highs and swing lows to understand the market’s current direction.

    The basic framework is simple:

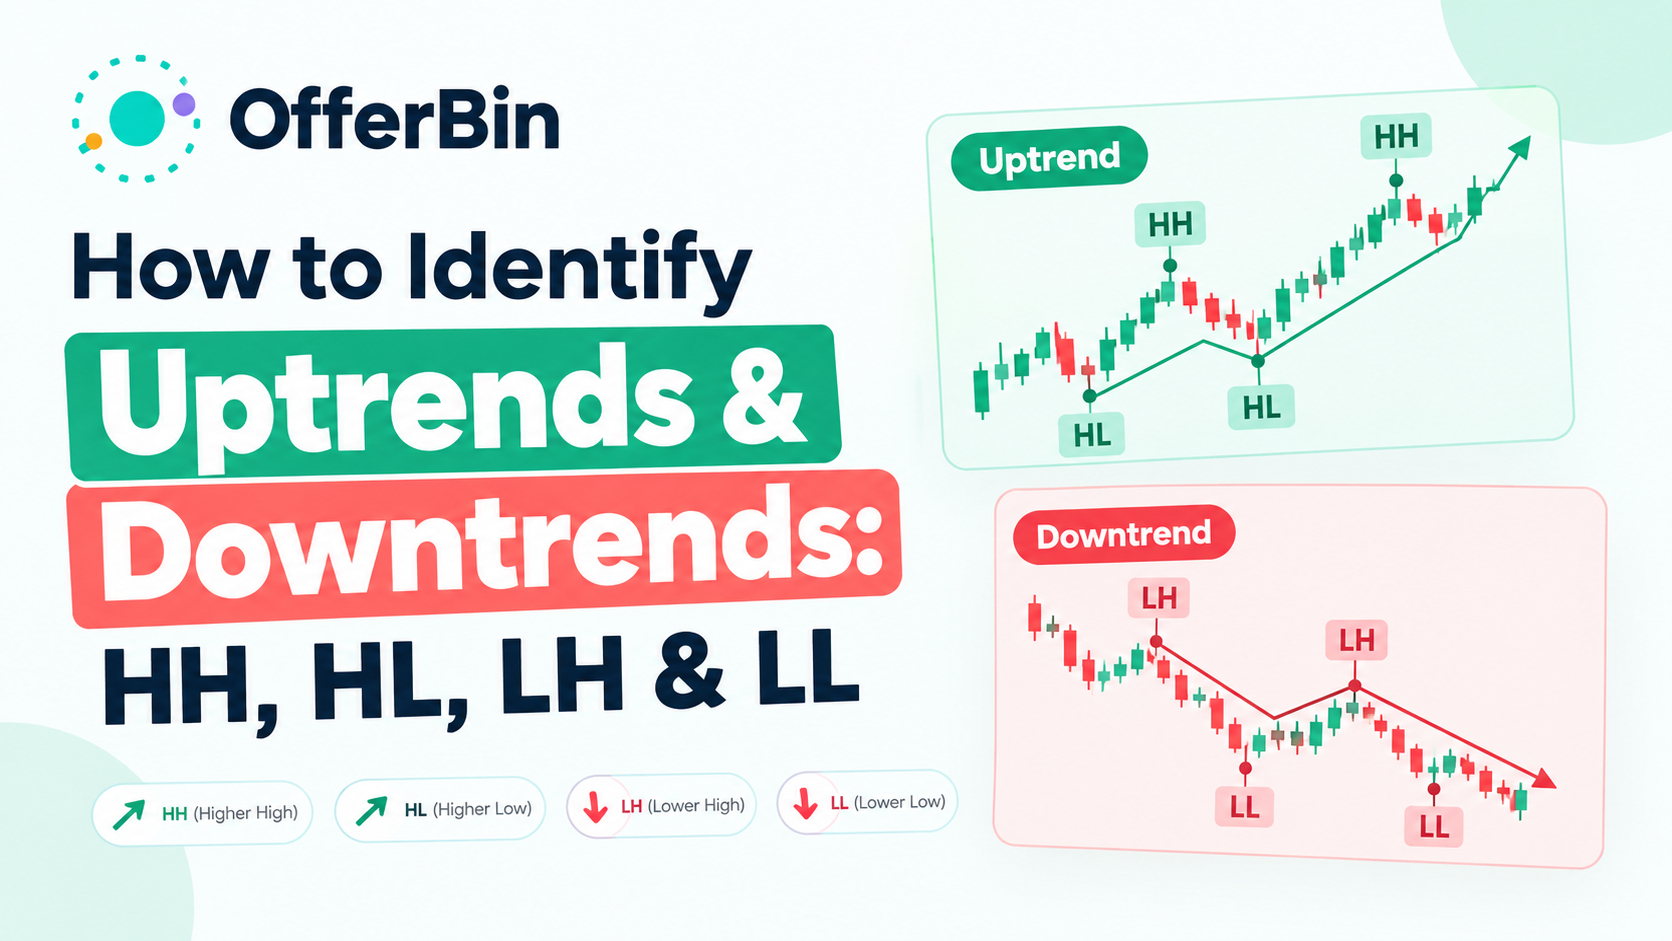
    • Uptrend: Higher highs (HH) and higher lows (HL)
    • Downtrend: Lower highs (LH) and lower lows (LL)
    • Sideways market: Price moves within a relatively defined range without a consistent sequence of higher or lower swings

    Fidelity and Charles Schwab use the same basic market-structure framework when explaining trend identification.

    For crypto traders and market observers, this framework can make price charts much easier to read. You can also use OfferBin’s live market data to check current crypto prices and compare price movements while studying market structure.

    How Do You Identify an Uptrend or Downtrend?

    You can identify an uptrend or downtrend by comparing important swing points on a price chart.

    An uptrend develops when price consistently forms higher highs and higher lows. Each major high is above the previous high, while each important pullback low remains above the previous low.

    A downtrend develops when price consistently forms lower highs and lower lows. Each rally fails below the previous high, while each major decline creates a new low.

    If neither pattern is clearly present, the market may be consolidating or moving sideways rather than trending.

    Market StructureHighsLowsTypical Direction
    UptrendHigher highsHigher lowsBullish
    DowntrendLower highsLower lowsBearish
    SidewaysSimilar/mixed highsSimilar/mixed lowsRange
    TransitionStructure becomes mixedStructure becomes mixedPossible reversal

    The important point is that one price move does not define a complete trend. Trend identification works better when you examine a sequence of meaningful swing points.

    What Is an Uptrend?

    An uptrend is a market structure in which price generally moves upward through a series of higher highs and higher lows.

    Imagine a market that moves like this:

    100 → 110 → 105 → 118 → 112 → 125

    The highs are:

    110 → 118 → 125

    Each high is higher than the previous one.

    The pullback lows are:

    105 → 112

    Each low is also higher than the previous one.

    That combination creates the classic higher-high, higher-low structure associated with an uptrend. Fidelity defines an uptrend as ascending peaks and troughs, specifically higher highs and higher lows.

    What Is a Higher High?

    A higher high (HH) occurs when price rises above a previous significant swing high.

    For example:

    • Previous swing high: $100
    • New swing high: $108

    Because $108 is above $100, the new point is a higher high.

    A series of higher highs suggests that buyers are able to push price beyond previous peaks.

    However, a higher high by itself does not automatically prove that a sustained uptrend exists. You also want to examine the lows between those highs.

    What Is a Higher Low?

    A higher low (HL) occurs when price pulls back but stops above a previous significant low.

    For example:

    • Previous swing low: $90
    • New swing low: $96

    Because $96 is above $90, the new low is a higher low.

    When higher highs and higher lows repeatedly appear together, the chart develops a rising structure.

    How Higher Highs and Higher Lows Create an Uptrend

    Think of an uptrend as a staircase.

    Price moves upward.

    Then it pulls back.

    But the pullback stops above the previous low.

    Price rises again and breaks the previous high.

    Then another pullback occurs.

    If the pattern continues, the market creates:

    HH → HL → HH → HL → HH

    That is the basic structure of an uptrend.


    What Is a Downtrend?

    A downtrend is the opposite structure.

    Price creates lower highs and lower lows as the market moves downward.

    For example:

    100 → 92 → 96 → 85 → 90 → 78

    The highs become:

    96 → 90

    Each is lower than the previous high.

    The lows become:

    92 → 85 → 78

    Each is lower than the previous low.

    That creates a descending market structure.

    Charles Schwab similarly describes downtrends as sequences of lower highs and lower lows.

    What Is a Lower High?

    A lower high (LH) forms when a rally fails below the previous significant high.

    For example:

    • Previous swing high: $100
    • New swing high: $94

    Because $94 is below $100, it is a lower high.

    Repeated lower highs indicate that rallies are losing ground compared with previous rallies.

    What Is a Lower Low?

    A lower low (LL) forms when price falls below a previous significant low.

    For example:

    • Previous swing low: $90
    • New swing low: $82

    Because $82 is below $90, the new point is a lower low.

    Repeated lower lows show that sellers are pushing price beneath previous lows.

    How Lower Highs and Lower Lows Create a Downtrend

    A typical downtrend can look like:

    LH → LL → LH → LL → LH → LL

    Price rallies but fails below the previous high.

    Then it falls below the previous low.

    The pattern repeats.

    This creates a descending staircase.


    Higher Highs and Higher Lows vs Lower Highs and Lower Lows

    The easiest way to remember the difference is to compare the structure rather than trying to memorize complicated definitions.

    TermMeaningMarket Structure
    Higher High (HH)New swing high above the previous highSupports bullish structure
    Higher Low (HL)New swing low above the previous lowSupports bullish structure
    Lower High (LH)New swing high below the previous highSupports bearish structure
    Lower Low (LL)New swing low below the previous lowSupports bearish structure

    The simple rule is:

    HH + HL = Uptrend

    LH + LL = Downtrend

    This framework is also used in crypto-chart education. Fidelity’s crypto chart guide describes an uptrend using higher highs and higher lows, a downtrend using lower highs and lower lows, and sideways price movement as consolidation.


    How to Identify an Uptrend on a Chart

    You do not need to inspect every single candle to identify a market trend. Start by looking for meaningful swing points.

    Mark the Major Swing Highs

    First, identify areas where price moved upward and then turned lower.

    These turning points can act as swing highs.

    Do not treat every tiny candle wick as a major swing high. The significance of a swing depends partly on the timeframe and surrounding price action.

    For more systematic chart analysis, technical tools can also define pivot highs and lows using surrounding bars. Fidelity, for example, describes pivot highs as highs surrounded by lower highs and pivot lows as lows surrounded by higher lows.

    Mark the Swing Lows

    Next, identify meaningful points where price declined and then began moving higher.

    These are swing lows.

    You now have two sets of information:

    • Swing highs
    • Swing lows

    The next step is to compare them.

    Compare Each High With the Previous High

    Ask:

    Is the new swing high above the previous swing high?

    If yes, you may have a higher high.

    If this happens repeatedly, bullish structure becomes more apparent.

    Compare Each Low With the Previous Low

    Now ask:

    Is the new swing low above the previous swing low?

    If yes, you may have a higher low.

    When higher highs and higher lows appear as a sequence, the evidence for an uptrend becomes stronger.

    Confirm the Sequence

    Do not label a market an uptrend simply because price increased for a few candles.

    Look for a recognizable sequence such as:

    HH → HL → HH → HL

    The more clearly this structure persists, the easier it becomes to describe the market as trending upward.


    How to Identify a Downtrend on a Chart

    The process is almost identical, but the structure is reversed.

    Identify Swing Highs

    Find the points where rallies ended and price began falling.

    Then compare each swing high with the previous one.

    Identify Swing Lows

    Find the points where declines ended and price began recovering.

    Then compare each low with the previous low.

    Look for Lower Highs

    If a rally ends below the previous significant high, the new point can be classified as a lower high.

    Look for Lower Lows

    If price subsequently falls below the previous significant low, the new point can be classified as a lower low.

    Confirm the Sequence

    A clearer downtrend structure looks like:

    LH → LL → LH → LL

    When this sequence persists, bearish market structure becomes more evident.


    What Are Swing Highs and Swing Lows?

    Swing highs and swing lows are important because they provide the reference points needed to identify market structure.

    A swing high is a meaningful local peak where price turns lower.

    A swing low is a meaningful local trough where price turns higher.

    The exact definition can vary depending on the timeframe and method being used.

    For example, a short-term trader might care about relatively small swings on a 15-minute chart, while someone studying a longer-term market structure may focus on weekly or monthly swings.

    This is why two people can look at the same asset and describe different short-term and long-term trends.

    Fidelity notes that trends can exist across primary, secondary, and minor time horizons, with shorter trends influencing movements within longer trends.


    Uptrend vs Downtrend vs Sideways Market

    Not every chart is trending.

    Sometimes price moves back and forth inside a range.

    This is commonly called a sideways market or consolidation.

    FeatureUptrendDowntrendSideways Market
    HighsHigherLowerOften similar/mixed
    LowsHigherLowerOften similar/mixed
    DirectionUpDownHorizontal
    StructureHH + HLLH + LLNo consistent sequence
    Market behaviorRisingFallingRange-bound

    Fidelity describes sideways markets as periods in which price moves horizontally within a range.

    Why This Matters

    A common mistake is assuming that every market must be either bullish or bearish.

    It does not.

    If price repeatedly moves between support and resistance without establishing a sequence of higher highs and higher lows or lower highs and lower lows, it may be better described as a range.

    CME Group also describes consolidation as a period in which price remains within a defined range before a possible continuation or reversal.


    How to Tell If a Trend Is Strong or Weak

    Market structure is the starting point, but you can examine additional evidence to understand the quality of a trend.

    1. Look at the Consistency of Swing Structure

    A clean sequence of HHs and HLs provides clearer bullish structure than a chart with frequent mixed highs and lows.

    Likewise, consistent LHs and LLs provide clearer bearish structure.

    2. Watch the Pullbacks

    In an uptrend, healthy-looking pullbacks often remain above important previous swing lows.

    In a downtrend, rallies may struggle to reclaim previous swing highs.

    The exact behavior varies by market and timeframe, so these observations should not be treated as guaranteed rules.

    3. Examine Support and Resistance

    Support and resistance can provide additional context.

    Support refers to areas where declining price may encounter buying interest, while resistance refers to areas where rising price may encounter selling pressure. CME Group explains that previous highs and lows, price levels, moving averages, and trendlines can all be used when identifying support and resistance.

    4. Consider Momentum and Volume

    Indicators such as moving averages, RSI and MACD can provide additional information about momentum and trend conditions.

    However, indicators should complement price structure rather than replace it.

    For example, an oscillator can remain overbought or oversold while a strong trend continues, so a single indicator reading should not automatically be treated as a reversal signal.


    Trend Continuation vs Trend Reversal

    One of the hardest parts of trend identification is deciding whether a market is experiencing a normal pullback or beginning a genuine reversal.

    Signs an Uptrend May Be Weakening

    Suppose a market has been forming:

    HH → HL → HH → HL

    Then it fails to create a meaningful new higher high.

    That alone does not necessarily mean the trend has reversed.

    But if price then breaks important structure and begins forming:

    LH → LL

    the evidence of a potential bearish transition becomes stronger.

    Signs a Downtrend May Be Weakening

    A downtrend might look like:

    LH → LL → LH → LL

    If price stops creating new lower lows, the downtrend may be losing momentum.

    If price then starts producing:

    HL → HH

    the market structure may be transitioning toward an uptrend.

    Why One Broken Level Does Not Automatically Confirm a Reversal

    A trendline break or failed high/low should generally be treated as information, not certainty.

    Fidelity notes that a break of a trendline can warn that the trend may be changing, but additional tools and signals should be used to confirm the change.

    CME Group likewise explains that reversal patterns can provide indications rather than absolute rules about what price will do next.

    That distinction matters because markets frequently produce temporary countertrend moves.


    Pullback vs Retracement vs Reversal

    These terms are related, but they describe different ideas.

    Pullback

    A pullback is a temporary move against the prevailing trend.

    For example, in an uptrend:

    HH → HL → HH

    The move from the new high down toward the higher low is a pullback.

    Retracement

    A retracement is also a move against the prior price direction. The term is often used when describing how much of a previous move price gives back.

    Reversal

    A reversal implies a more meaningful change in the prevailing direction.

    For example:

    Uptrend → structure weakens → lower high → lower low

    That sequence provides stronger evidence of a potential bearish transition than a simple temporary dip.

    The distinction is important because calling every pullback a reversal can lead to an incorrect interpretation of market structure.


    How Timeframes Change Trend Identification

    A market can have different trends on different timeframes.

    For example:

    • Weekly chart: Uptrend
    • Daily chart: Uptrend
    • 4-hour chart: Downtrend
    • 15-minute chart: Uptrend

    There is no contradiction.

    The shorter timeframe may simply represent a countertrend move inside the larger trend.

    Charts can be viewed across different time periods, and CME Group notes that traders select chart timeframes according to their trading horizon.

    A Simple Multi-Timeframe Approach

    If you want broader context:

    1. Start with a higher timeframe.
    2. Identify the major market structure.
    3. Move to a lower timeframe.
    4. Identify the current short-term structure.
    5. Compare the two.
    6. Avoid assuming the lower-timeframe trend represents the entire market.

    This helps prevent a short-term rally from being mistaken for a complete long-term reversal.


    Can Indicators Confirm an Uptrend or Downtrend?

    Indicators can provide additional context, but market structure should remain central when your goal is to identify the basic direction of price.

    Moving Averages

    Moving averages smooth price data and can help visualize directional movement.

    RSI

    The Relative Strength Index measures recent upward and downward price movement and is commonly used to study momentum.

    MACD

    MACD is another momentum-oriented indicator that can help traders examine changes in trend and momentum.

    Fidelity’s crypto chart education specifically discusses moving averages, MACD and RSI alongside trend analysis.

    The key point is simple:

    Use indicators as supporting evidence, not as a replacement for reading price structure.


    How to Identify Market Trends in Crypto

    Crypto markets can be particularly useful for practicing trend identification because major tokens can experience substantial price movements across different timeframes.

    The same basic framework applies:

    Bullish crypto structure

    Higher High → Higher Low → Higher High → Higher Low

    Bearish crypto structure

    Lower High → Lower Low → Lower High → Lower Low

    Consolidation

    Repeated movement inside a relatively defined range

    When studying a cryptocurrency, first identify the structure before looking for more complicated indicators.

    You can then use OfferBin’s live crypto price tracker to check current market prices and its token converter to compare supported assets. OfferBin describes its service as a live price tracker and converter rather than an exchange or custody platform.

    For broader Bitcoin price context, you can also read OfferBin’s guide on Bitcoin price movement and the factors affecting its trend.


    Common Mistakes When Identifying Trends

    Mistake 1: Looking at Only One High

    A single higher high does not automatically establish an uptrend.

    Look at the surrounding swing lows and previous structure.

    Mistake 2: Looking at Only One Low

    The same applies to a single lower low.

    A broader sequence provides more useful information.

    Mistake 3: Treating Every Wick as a Major Swing

    Tiny price fluctuations can create many apparent highs and lows.

    Focus on meaningful swings relevant to your chosen timeframe.

    Mistake 4: Ignoring the Timeframe

    A 15-minute downtrend can exist inside a daily uptrend.

    Always know which timeframe you are analyzing.

    Mistake 5: Calling Every Pullback a Reversal

    A temporary decline does not automatically end an uptrend.

    Look for meaningful structural changes.

    Mistake 6: Ignoring Sideways Markets

    Mixed highs and lows may indicate consolidation rather than a clear directional trend.

    Mistake 7: Relying on One Indicator

    An RSI or MACD reading should not automatically override what price structure is showing.

    Mistake 8: Assuming Trend Analysis Predicts the Future

    Technical analysis can help organize historical and current price behavior, but it cannot guarantee what the market will do next.


    A Simple Trend Identification Checklist

    Before labeling a market as an uptrend, ask:

    • Are important highs getting higher?
    • Are important lows getting higher?
    • Is the HH/HL sequence reasonably consistent?
    • Are pullbacks holding above meaningful previous lows?
    • Does the higher timeframe support the same direction?
    • Are support/resistance and other evidence consistent with the structure?

    Before labeling a market as a downtrend, ask:

    • Are important highs getting lower?
    • Are important lows getting lower?
    • Is the LH/LL sequence reasonably consistent?
    • Are rallies failing below meaningful previous highs?
    • Does the higher timeframe support the same direction?
    • Is other market evidence consistent with the bearish structure?

    If the answers are mixed, the market may be transitioning or consolidating rather than clearly trending.


    A Quick Example of Uptrend and Downtrend Structure

    Imagine a cryptocurrency begins at $100.

    Uptrend example

    • Price rises to $115 — Higher High
    • Falls to $108 — Higher Low
    • Rises to $125 — Higher High
    • Falls to $116 — Higher Low
    • Rises to $135 — Higher High

    The structure is:

    HH → HL → HH → HL → HH

    That is a classic bullish structure.

    Downtrend example

    Now imagine another asset starts at $100.

    • Falls to $90 — initial decline
    • Rises to $96 — Lower High
    • Falls to $82 — Lower Low
    • Rises to $89 — Lower High
    • Falls to $76 — Lower Low

    The structure becomes:

    LH → LL → LH → LL

    That is a classic bearish structure.

    These examples are simplified to demonstrate structure rather than predict any particular asset’s future movement.


    How to Read Market Structure Faster

    Once you understand HH, HL, LH and LL, you can simplify your chart-reading process.

    Step 1: Zoom out

    Start with a timeframe large enough to see meaningful swings.

    Step 2: Find the obvious peaks and troughs

    Do not begin with every small candle.

    Step 3: Label the swings

    Mark:

    • HH
    • HL
    • LH
    • LL

    Step 4: Look for repetition

    One point is information.

    A sequence is structure.

    Step 5: Check for consolidation

    If the structure is mixed, do not force the market into an uptrend or downtrend category.

    Step 6: Check another timeframe

    See whether the short-term structure agrees with the broader market structure.

    Step 7: Look for confirmation

    Use support/resistance, momentum, volume, trendlines or indicators as additional evidence where appropriate.


    Frequently Asked Questions

    What is an uptrend?

    An uptrend is a market condition in which price generally forms a sequence of higher highs and higher lows. The rising swing structure indicates that successive peaks and pullbacks are occurring at progressively higher levels.

    What is a downtrend?

    A downtrend is a market condition in which price generally forms lower highs and lower lows. Each significant rally fails below the previous high while declines create progressively lower lows.

    What do higher highs and higher lows mean?

    A higher high means a new significant peak is above the previous peak. A higher low means a new significant trough remains above the previous trough. Together, repeated HHs and HLs form the basic structure of an uptrend.

    What do lower highs and lower lows mean?

    A lower high occurs when a rally ends below the previous significant high. A lower low occurs when price falls below the previous significant low. Repeated LHs and LLs form the basic structure of a downtrend.

    How do you identify an uptrend on a chart?

    Identify the major swing highs and lows, then compare each one with the previous point. If price repeatedly creates higher highs and higher lows, the chart is showing an uptrend structure.

    How do you identify a downtrend on a chart?

    Identify the major swing highs and lows and compare them sequentially. A repeated pattern of lower highs and lower lows indicates a downtrend.

    Can a market be in an uptrend and downtrend at the same time?

    Yes, when you use different timeframes. A short-term downtrend can occur inside a longer-term uptrend. That is why timeframe selection matters when analyzing market structure.

    Does a lower high mean an uptrend has ended?

    Not necessarily. One lower high can be part of a temporary pullback or consolidation. Stronger evidence of a bearish transition comes from a broader change in structure, such as sustained lower highs and lower lows.

    Is a pullback the same as a trend reversal?

    No. A pullback is a temporary move against the prevailing trend, while a reversal implies a more meaningful change in direction. Confirmation is important because temporary countertrend movements can occur during established trends.

    Are indicators necessary to identify an uptrend or downtrend?

    No. Basic trend identification can be done by studying price structure and swing highs/lows. Indicators such as moving averages, RSI and MACD can provide additional context but should not be treated as infallible signals.


    Final Takeaway

    Learning how to identify uptrends and downtrends starts with one simple idea: study the sequence of meaningful highs and lows.

    Remember the four key structures:

    Higher High + Higher Low → Uptrend

    Lower High + Lower Low → Downtrend

    Mixed Structure → Possible Transition

    No Clear Direction → Possible Consolidation

    From there, add context with swing points, support and resistance, timeframe analysis, momentum and other technical tools.

    Most importantly, avoid making a trend decision from a single candle, one price spike, or one indicator reading. Trends are structures that develop over a sequence of price movements.

    For crypto market research, you can use OfferBin’s live prices and token conversion tools to check current market data while applying these concepts. OfferBin provides market data for 25+ tokens and explicitly states that its tools are for reference rather than trading or custody.

    If you want to continue building your crypto-market knowledge, the OfferBin blog provides additional crypto-focused educational content.


    Important Note

    Trend analysis is an educational framework for interpreting price behavior. It does not guarantee future price direction, and technical patterns can fail. Crypto assets can be highly volatile, so market-structure analysis should not be treated as personalized financial advice.

    Sources for Further Reading

    • Fidelity’s basic concepts of trend explains higher highs, higher lows, lower highs, lower lows, sideways markets and trendlines.
    • Fidelity’s crypto chart guide covers uptrends, downtrends, consolidation and common chart indicators.
    • Charles Schwab’s chart-reading guide provides additional context on trend structure and confirmation.
    • CME Group’s technical-analysis resources cover trends, reversals, support/resistance and indicators.

  • Howard’s Appliance Chapter 11: What Happened and Next in 2026

    Howard’s Appliance Chapter 11: What Happened and Next in 2026

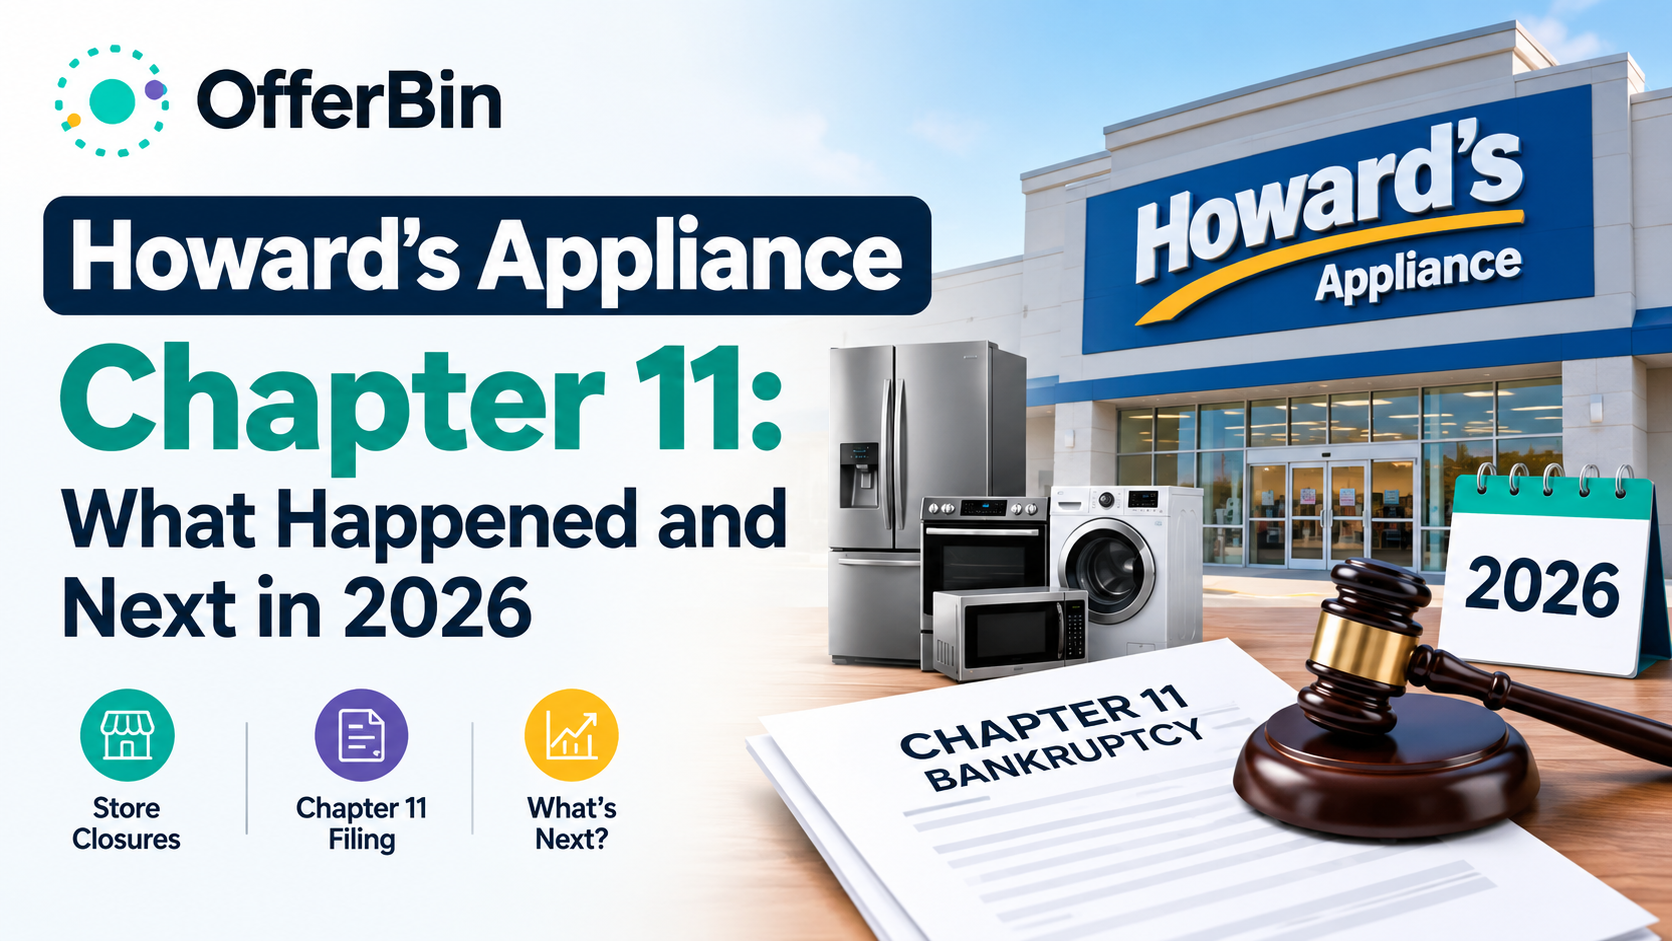
    Howard’s Appliances filed for Chapter 11 bankruptcy on December 10, 2025, after shutting down its Southern California retail operations. The company’s bankruptcy case is still active in September 2026, but the situation is different from a typical Chapter 11 turnaround: court filings indicate that Howard’s planned to liquidate its remaining assets and dissolve the business. A creditor has also asked the court to convert the case from Chapter 11 to Chapter 7, with a hearing scheduled for September 30, 2026.

    Howard’s Appliance Bankruptcy: Quick Facts

    DetailCurrent information
    CompanyHoward’s Appliances, Inc.
    IndustryAppliance retail
    Founded1946
    BankruptcyChapter 11
    Filing dateDecember 10, 2025
    Bankruptcy case2:25-bk-21116-BB
    CourtU.S. Bankruptcy Court, Central District of California
    Retail shutdownDecember 6, 2025
    Remaining retail operationsClosed
    2026 developmentCreditor filed a motion to convert the case to Chapter 7
    Conversion hearingSeptember 30, 2026
    Current statusBankruptcy case remains active

    What Happened to Howard’s Appliance?

    Howard’s Appliances, a long-established Southern California retailer of appliances and mattresses, abruptly shut down its retail operations on December 6, 2025.

    The shutdown came only a few days before the company formally filed for Chapter 11 bankruptcy protection.

    The company had been acquired by S5 Equity in April 2025. At the time of the acquisition, the buyer described the transaction as part of an effort to build on Howard’s long-standing retail business and strengthen its future.

    Less than eight months later, Howard’s closed its stores and entered bankruptcy.

    The sudden shutdown created immediate problems for customers who had already purchased appliances but had not yet received their orders. Employees were also affected by the abrupt closure.

    The bankruptcy filing followed the store shutdown on December 10, 2025.

    Why Did Howard’s Appliance File for Chapter 11?

    Howard’s bankruptcy filings and statements attributed the company’s financial difficulties to several pressures, including tariffs, declining consumer spending and broader macroeconomic challenges.

    These factors matter because appliance retail depends heavily on consumer demand and inventory management. Large-ticket products such as refrigerators, washers, dryers and other appliances can be particularly sensitive to changes in household spending.

    Howard’s also faced financial obligations to creditors and suppliers.

    However, it is important not to reduce the bankruptcy to one single cause. The available records describe a combination of financial and operating pressures rather than establishing one factor as the sole reason for the filing.

    The broader business lesson is that revenue alone does not determine financial stability. Cash flow, debt obligations, supplier relationships, inventory, operating costs and consumer demand can all affect whether a retailer can continue operating.

    For broader context, see OfferBin’s guide on financial stability during economic uncertainty.

    When Did Howard’s Appliance Stores Close?

    Howard’s retail operations ended on December 6, 2025.

    Reports from Southern California indicated that customers arrived at stores expecting normal operations but instead found them closed. Some customers also reported problems reaching the company about deliveries and outstanding orders.

    The shutdown affected Howard’s Southern California retail footprint.

    The bankruptcy filings later indicated that the company moved remaining inventory and assets from its retail locations to a warehouse in City of Industry, California.

    The company subsequently vacated its retail locations and rejected its commercial leases other than the warehouse lease.

    That distinction is important.

    The bankruptcy case did not simply involve temporarily closing stores while preparing to reopen them. Court documents described a liquidation process involving the company’s remaining assets.

    Is Howard’s Appliance Going Out of Business?

    Based on the available bankruptcy filings, Howard’s Appliances was pursuing liquidation rather than a conventional Chapter 11 business turnaround.

    A company can use Chapter 11 to reorganize and continue operating, but Howard’s filings described a plan to liquidate remaining inventory and assets, use the proceeds to address creditor claims and ultimately dissolve the business.

    That makes Howard’s situation different from a retailer that temporarily closes underperforming locations while keeping its broader business operating.

    As of September 16, 2026, the bankruptcy case remains active, but the available court record does not establish that Howard’s retail stores are reopening.

    What Does Chapter 11 Mean for Howard’s Appliance?

    Chapter 11 is a form of bankruptcy protection generally used to allow a business to reorganize its financial affairs under court supervision.

    A Chapter 11 case can involve:

    • Restructuring debt
    • Selling assets
    • Rejecting leases
    • Negotiating with creditors
    • Developing a bankruptcy plan
    • Continuing some or all business operations
    • Liquidating assets when reorganization is not practical

    The important point in Howard’s case is that Chapter 11 did not necessarily mean the stores would reopen.

    The company’s own bankruptcy filings described liquidation of its remaining assets as part of its strategy.

    That is why simply seeing the words “Chapter 11” does not tell the whole story. You also need to examine what the debtor’s plan actually proposes.

    What Happened to Howard’s Appliance Employees?

    The abrupt closure affected Howard’s workforce.

    Court filings state that Howard’s laid off nearly all of its employees after deciding to shut down its operations.

    The filings also state that the company paid accrued wages, benefits and other compensation due to employees before the bankruptcy filing.

    This is an important distinction when discussing employee impact: the closure resulted in widespread layoffs, but bankruptcy records also contain information about amounts owed and payments made to employees.

    What Happened to Howard’s Appliance Customers?

    Customers were among the people most immediately affected by the shutdown.

    Reports following the closure described customers trying to find out what would happen to appliances they had already ordered, including products that had not yet been delivered.

    A bankruptcy filing can make customer claims more complicated because customers may become creditors of the bankruptcy estate depending on the circumstances of their transaction.

    For example, a customer who paid for merchandise but never received it may have a claim against the company. The treatment of that claim depends on the facts, applicable bankruptcy rules and the court process.

    Customers should therefore avoid assuming that every unpaid order automatically receives the same treatment.

    The bankruptcy court’s notices explain that a proof of claim is a signed statement describing a creditor’s claim and that creditors may need to file a claim in certain circumstances to preserve their ability to participate in the bankruptcy process.

    Anyone with a disputed or unresolved Howard’s order should rely on the official bankruptcy notices and applicable legal guidance rather than assuming that a social-media post or general bankruptcy explanation applies to their individual situation.

    What Happened to Howard’s Remaining Inventory?

    The bankruptcy process moved toward selling or otherwise disposing of Howard’s remaining assets.

    Court documents show that Howard’s sought authorization to conduct an auction and/or bulk sale of personal property and other estate assets.

    The company’s remaining inventory and assets had been moved from retail locations to its warehouse in City of Industry.

    This is another reason the case should not be viewed simply as a temporary retail closure.

    The bankruptcy process involved converting business assets into proceeds that could be used within the bankruptcy estate.

    Howard’s Appliance Bankruptcy Timeline

    DateEvent
    April 2025S5 Equity acquired Howard’s Appliances
    December 6, 2025Howard’s retail operations shut down
    December 10, 2025Howard’s filed for Chapter 11
    December 12, 2025Howard’s filed a Chapter 11 liquidating plan
    Early 2026Bankruptcy proceedings continued and remaining assets became part of the liquidation process
    April 2026Howard’s sought authority for an auction and/or bulk sale of estate property
    June–August 2026Court proceedings continued concerning asset sales and secured-creditor liens
    August 31, 2026NorthPoint Commercial Finance filed a motion seeking conversion from Chapter 11 to Chapter 7
    September 1, 2026Court set a hearing on the conversion motion
    September 30, 2026Scheduled hearing on the Chapter 7 conversion request

    What Is Happening With Howard’s Appliance in 2026?

    The biggest development in the case came at the end of August 2026.

    NorthPoint Commercial Finance, a creditor in the bankruptcy case, filed a motion asking the court to convert Howard’s case from Chapter 11 to Chapter 7.

    The court subsequently scheduled a hearing for September 30, 2026.

    This does not mean the case has already been converted to Chapter 7.

    A motion is a request to the court. The court still has to consider the request and enter an appropriate order.

    For readers following the company, the September 30 hearing is therefore an important date.

    Chapter 11 vs. Chapter 7: What’s the Difference?

    Chapter 11Chapter 7
    Often used for business reorganizationGenerally involves liquidation
    Can allow a business to restructureA trustee generally administers the bankruptcy estate
    A company may continue operatingBusiness operations may end or be substantially limited
    Plans and creditor negotiations can play a major roleNon-exempt assets may be liquidated
    Can also be used in liquidation situationsPrimarily associated with liquidation

    The distinction matters in Howard’s case because its Chapter 11 filings already described a liquidation strategy.

    The pending Chapter 7 motion is therefore another stage in determining how the bankruptcy estate will ultimately be administered.

    It should not be described as an already-decided outcome until the court rules on the motion.

    Is Howard’s Appliance Closing All Its Stores?

    The available bankruptcy filings indicate that Howard’s had already shut its retail operations and vacated its retail locations.

    The company’s remaining assets were moved toward its warehouse and liquidation process.

    Therefore, the current bankruptcy story is not primarily about a few underperforming stores being closed while the rest of the chain continues normally.

    The evidence points to a much broader shutdown of Howard’s retail business.

    Why Did Howard’s Appliance Close Its Stores?

    The company’s reported explanation pointed to several financial pressures, including:

    • Tariffs
    • Lower consumer spending
    • Broader macroeconomic challenges
    • Financial pressure on the business
    • Obligations to creditors and other parties

    The company had also undergone an ownership change earlier in 2025, when S5 Equity acquired Howard’s.

    It is important to distinguish the documented sequence of events from speculation about causation. The fact that an acquisition happened before the bankruptcy does not by itself establish that the acquisition caused the bankruptcy.

    What Happens Next for Howard’s Appliance?

    The immediate question is what happens with the pending Chapter 7 conversion motion.

    The scheduled September 30, 2026 hearing may provide the next major development in the case.

    Beyond that, the bankruptcy process can involve:

    • Further asset sales
    • Resolution of creditor claims
    • Distribution of available proceeds
    • Court orders concerning secured creditors
    • Additional bankruptcy filings
    • Possible conversion or continuation of the case
    • Final administration of the bankruptcy estate

    The exact outcome depends on future court orders and the administration of the case.

    Readers should therefore be cautious with claims that Howard’s will reopen, that all creditors will be paid in full, or that a specific future outcome has already been decided.

    What Should Customers Watch For?

    Customers with unresolved Howard’s transactions should pay attention to official bankruptcy notices rather than relying only on older news stories.

    Important information can include:

    • Proof-of-claim deadlines
    • Court notices
    • Orders affecting the bankruptcy estate
    • Information about customer claims
    • Asset-sale developments
    • Any notices concerning distributions

    A customer should also keep documentation such as:

    • Purchase receipts
    • Order confirmations
    • Payment records
    • Delivery records
    • Refund communications
    • Emails or other correspondence

    The treatment of an individual customer claim can depend on the specific circumstances, so this article should not be treated as personalized legal advice.

    What Does Howard’s Appliance Chapter 11 Mean for the Retail Industry?

    Howard’s case also illustrates a broader problem facing retailers.

    A retailer can be affected by several pressures simultaneously:

    • Changing consumer demand
    • Higher costs
    • Inventory commitments
    • Supplier obligations
    • Debt
    • Rent and real-estate costs
    • Financing conditions
    • Competition
    • Supply-chain disruption

    When several pressures occur together, a retailer may have fewer options for maintaining normal operations.

    Howard’s case is particularly notable because its bankruptcy filing came after a long history in Southern California and shortly after its acquisition by S5 Equity.

    That combination makes the case useful as a real-world example of how quickly the financial position of a retail business can change.

    Frequently Asked Questions

    Why did Howard’s Appliance file for Chapter 11?

    Howard’s reported that tariffs, declining consumer spending and broader macroeconomic conditions contributed to the decision. Bankruptcy filings also show that the company was dealing with financial obligations and moved toward liquidating its remaining assets.

    Is Howard’s Appliance going out of business in 2026?

    The available bankruptcy filings indicate that Howard’s planned to liquidate its remaining assets and dissolve the business. Its retail operations had already shut down. However, the bankruptcy case itself remains active, and future court orders will determine how the case concludes.

    Is Howard’s Appliance still open?

    Howard’s Southern California retail operations closed on December 6, 2025. Available bankruptcy filings indicate that the company subsequently vacated its retail locations and moved remaining assets toward the liquidation process.

    Is Howard’s Appliance closing all its stores?

    The company’s retail operations were shut down across its Southern California locations in December 2025. Court filings subsequently described the company’s retail leases as vacated or rejected, apart from its warehouse lease.

    What happened to Howard’s Appliance customers?

    Some customers had orders that had not been delivered when the stores closed. Customers with unresolved claims may need to follow the bankruptcy court’s procedures and notices applicable to their claims.

    What happened to Howard’s Appliance employees?

    Court filings state that Howard’s laid off nearly all of its employees after deciding to permanently shut down its operations.

    What does Chapter 11 mean for Howard’s Appliance customers?

    Chapter 11 places the company’s financial affairs under bankruptcy-court supervision. For customers with unresolved claims, the bankruptcy process can determine how and when those claims are handled. The specific treatment depends on the individual circumstances and court process.

    Is Howard’s Appliance becoming Chapter 7?

    A creditor, NorthPoint Commercial Finance, filed a motion on August 31, 2026, requesting conversion of the case from Chapter 11 to Chapter 7. A hearing was scheduled for September 30, 2026. The filing of the motion does not itself mean the court has approved the conversion.

    When is the next Howard’s Appliance bankruptcy hearing?

    The bankruptcy docket lists a hearing on the Chapter 7 conversion motion for September 30, 2026, at 10:00 a.m. in the U.S. Bankruptcy Court for the Central District of California in Los Angeles.

    What happened to Howard’s Appliance inventory?

    Court documents indicate that remaining inventory and assets were moved from the retail stores to the company’s warehouse in City of Industry. The bankruptcy process subsequently involved efforts to sell or otherwise dispose of estate assets.

    The Bottom Line on Howard’s Appliance Chapter 11

    Howard’s Appliances’ bankruptcy story began with an abrupt retail shutdown in December 2025, followed by a Chapter 11 filing. But the case did not develop into a straightforward store-reorganization story.

    Court filings indicate that Howard’s moved toward liquidation, including the sale of remaining assets, while nearly all employees were laid off and retail locations were vacated.

    As of September 16, 2026, the case remains active. The latest major development is a creditor’s request to convert the Chapter 11 case to Chapter 7, with a hearing scheduled for September 30.

    That means the Howard’s bankruptcy story is still developing.

    For broader business and financial education, you can explore OfferBin’s Business Guide and its resources on managing financial stability during uncertain economic conditions.