
Day: September 20, 2026

  • How to Read Stock Market Futures Before the Open

    How to Read Stock Market Futures Before the Open

    If you want an early read on how the U.S. stock market may open, stock market futures are one of the first places to look.

    Futures such as the S&P 500, Nasdaq-100, and Dow Jones contracts trade outside regular stock-market hours, allowing prices to respond to overnight news, economic developments, earnings announcements, and global market moves. CME Group lists futures across major U.S. equity benchmarks including the S&P 500, Nasdaq-100, Dow Jones and Russell 2000.

    But there is an important distinction: futures can provide context about the potential market open, but they do not guarantee what stocks will do after the opening bell.

    To read stock futures properly, you need to look beyond whether the numbers are simply green or red. You should compare the major contracts, measure the size of their moves, understand what caused the move, and check whether the signal is broad or concentrated.

    What Are Stock Market Futures?

    Stock market futures are contracts based on major stock-market indexes. Instead of representing ownership of individual companies, equity-index futures provide exposure to the movement of an underlying index.

    The major U.S. equity-index futures include contracts based on:

    • S&P 500
    • Nasdaq-100
    • Dow Jones Industrial Average
    • Russell 2000

    These markets trade for much longer hours than the regular U.S. stock market, giving participants a way to react to information while the cash equity market is closed. CME describes its U.S. equity-index futures markets as providing around-the-clock access across major benchmarks.

    That makes futures useful for answering a simple pre-market question:

    What is the market pricing in right now before regular stock trading begins?

    For more market-information resources, you can also explore OfferBin.

    Why Do Stock Futures Matter Before the Market Opens?

    During the regular session, stocks trade on exchanges and prices continuously respond to new information.

    Before the U.S. cash market opens, however, major news can still arrive.

    For example:

    • A company can release earnings.
    • An economic report can change expectations about interest rates.
    • Federal Reserve officials can make important comments.
    • European or Asian markets can move sharply.
    • Geopolitical developments can change risk sentiment.
    • Bond yields or other major financial markets can move.

    Equity-index futures can react to these developments before the regular U.S. stock session begins.

    That is why financial headlines often report statements such as “S&P futures are higher” or “Nasdaq futures are lower.”

    The important point is that the futures move is an early market signal, not a guaranteed forecast for the entire trading session.


    Which Stock Futures Should You Watch?

    Three contracts are particularly useful for understanding the broad U.S. market:

    FuturesUnderlying IndexWhat It Helps You Understand
    ESS&P 500Broad large-cap U.S. market
    NQNasdaq-100Technology and growth-heavy exposure
    YMDow Jones Industrial AverageLarge established blue-chip companies
    RTYRussell 2000Smaller U.S. companies

    CME offers equity-index futures covering these major benchmarks, including E-mini and Micro E-mini contracts.

    S&P 500 Futures (ES)

    ES, commonly referring to E-mini S&P 500 futures, tracks the S&P 500.

    Because the S&P 500 covers a broad group of large U.S. companies across multiple sectors, ES is often useful as a broad indicator of U.S. equity-market direction.

    Nasdaq-100 Futures (NQ)

    NQ tracks the Nasdaq-100.

    The Nasdaq-100 has substantial exposure to large technology and growth-oriented companies, so NQ can behave differently from broader index futures when technology stocks are driving the market.

    Dow Jones Futures (YM)

    YM represents futures linked to the Dow Jones Industrial Average.

    The Dow contains 30 large companies, so it represents a narrower part of the U.S. equity market than the S&P 500.

    Russell 2000 Futures (RTY)

    RTY tracks the Russell 2000 and provides additional information about smaller U.S. companies.

    Adding RTY to your pre-market review can help you determine whether a move is concentrated in large-cap indexes or appears more broadly distributed across different segments of the market.


    How to Read Stock Market Futures Before the Open

    A useful pre-market process is:

    Check direction → measure the move → compare indexes → identify the catalyst → check the potential open → reassess before the bell

    Here is how each step works.

    Check the Direction of the Futures

    Start by looking at the current futures price relative to the relevant previous reference point.

    If futures are higher, the contracts are indicating stronger overnight pricing.

    If futures are lower, the contracts are indicating weaker overnight pricing.

    For example:

    Futures MoveBasic Interpretation
    ES +0.05%Almost unchanged
    ES +0.50%Moderately higher
    ES +1.50%Significant overnight move
    ES -0.25%Slightly lower
    ES -1.00%Meaningful overnight weakness

    These figures are examples, not fixed thresholds.

    The size of a move matters because a futures contract being up 0.05% tells you something very different from one being up 1.5%.


    Look at the Percentage Change, Not Just Points

    One of the easiest mistakes is focusing only on the number of points.

    Suppose a futures contract is 50 points higher.

    That sounds significant until you consider the index level.

    A better approach is to look at:

    • Current futures price
    • Previous reference price
    • Point change
    • Percentage change

    Percentage change makes it easier to compare the magnitude of movements across different indexes.

    For example:

    Previous level: 5,000
    Current level: 5,025
    Point change: +25
    Percentage change: +0.50%

    The percentage figure immediately tells you that the move represents roughly half of one percent.


    Compare ES, NQ and YM

    Don’t rely on one futures contract.

    Look at the major indexes together.

    For example:

    ESNQYMWhat It May Suggest
    UpUpUpBroad overnight strength
    UpStronger UpFlatTechnology/growth leadership
    FlatUpDownMixed market conditions
    DownDownDownBroad overnight weakness
    UpDownFlatDivergent market

    These are interpretations, not predictions.

    The value comes from identifying relationships between the contracts.

    If ES, NQ and YM are all moving in the same direction, the overnight signal is broader.

    If one index moves sharply while another barely moves, the market may be reacting to a specific sector, company group, interest-rate change, or other catalyst.


    What Does It Mean When Stock Futures Are Up?

    When stock futures are higher before the open, they indicate that the futures market is currently pricing at higher levels than the relevant previous reference.

    That can suggest a stronger potential opening tone.

    But don’t automatically translate:

    Futures up → stocks will stay up all day.

    That conclusion goes too far.

    Futures can change before the open, and the regular stock market can introduce new liquidity, orders and information once trading begins.

    A better interpretation is:

    Higher futures indicate stronger overnight pricing and may point toward a higher opening level, but they do not establish the direction of the entire trading session.

    The same principle applies when futures are lower.


    How Do Futures Indicate Whether the Market May Open Higher or Lower?

    The basic idea is straightforward.

    If the futures market is pricing an index above its relevant cash-market reference, that can indicate a higher potential opening level.

    If futures are below that reference, it can indicate a lower potential opening level.

    For example, imagine:

    • Previous S&P 500 close: 6,000
    • Current futures-implied level: 6,030

    The market would be indicating a potential opening around 30 points higher than the previous close.

    However, the exact relationship between futures and the cash index is more complicated than simply comparing two numbers.

    That’s where fair value becomes important.


    What Is Fair Value?

    Fair value is a theoretical relationship between the futures contract and its underlying cash index that accounts for factors such as financing costs and expected dividends over the relevant period.

    You usually don’t need to calculate fair value manually.

    Market-data services can provide fair-value information alongside futures and index data.

    This matters because the raw futures price isn’t always enough to understand the expected opening relationship.

    For example, suppose:

    • The S&P 500 closed at 6,000
    • Futures are trading 25 points higher
    • Fair value indicates a different theoretical relationship

    The futures price should therefore be interpreted alongside the relevant cash-index and fair-value information rather than in isolation.


    What Is an Implied Open?

    The implied open is an estimate of where an underlying market index may begin regular trading based on available futures information and the relationship between futures and the cash market.

    It is an estimate, not a guaranteed opening print.

    The implied level can change right up until the regular market opens because futures prices continue moving.

    This is why a headline you see early in the morning may not match the final opening level.

    A useful mental model is:

    Futures → relationship with cash index/fair value → potential opening level

    Not:

    Futures → guaranteed opening price


    How to Read ES, NQ and YM Together

    Looking at the three major contracts together can reveal more information than watching a single futures quote.

    When ES, NQ and YM Are All Higher

    If all three are higher, the overnight move appears broader across major U.S. equity benchmarks.

    That doesn’t guarantee a strong regular session, but it provides a more consistent pre-market signal than one index moving alone.

    When NQ Is Much Stronger Than ES

    A stronger NQ relative to ES can indicate that technology and growth-oriented stocks are contributing more to the overnight move.

    You would then want to look at what is driving technology-related sentiment.

    Possible catalysts include:

    • Major technology earnings
    • Interest-rate expectations
    • Bond-yield changes
    • Semiconductor news
    • Large technology-company announcements

    When YM Is Stronger Than NQ

    A stronger Dow futures contract with weaker Nasdaq futures can indicate a different market leadership pattern.

    This may occur when investors are responding differently to sectors represented more heavily in the Dow compared with technology-heavy parts of the market.

    When the Futures Diverge

    Divergence means the contracts are not moving together.

    For example:

    • ES +0.2%
    • NQ -0.4%
    • YM +0.1%

    That’s a mixed signal.

    Rather than forcing a bullish or bearish interpretation, ask:

    Why is Nasdaq futures behaving differently?

    That question can lead you toward the actual catalyst.


    What Causes Stock Futures to Move Overnight?

    Understanding why futures moved can be more useful than simply knowing that they moved.

    Economic Data

    Important economic releases can move futures rapidly.

    Examples include:

    • Inflation data
    • Employment reports
    • GDP data
    • Retail sales
    • Consumer confidence
    • Manufacturing data

    The market reaction can depend on how the actual result compares with expectations.

    Federal Reserve News

    Interest-rate expectations can have a major effect on equity markets.

    Comments from Federal Reserve officials or changes in expectations around monetary policy can therefore influence index futures.

    Earnings Announcements

    Large publicly traded companies can influence index futures when they report earnings outside regular market hours.

    The effect can be particularly noticeable when the company has a significant weighting in a major index.

    Global Markets

    U.S. futures can also react to movements in major overseas markets.

    European and Asian market developments may affect global risk sentiment before U.S. trading begins.

    Interest Rates and Bond Yields

    Changes in Treasury yields can influence how investors value stocks, particularly growth-oriented companies.

    This is one reason NQ and broader equity futures can sometimes respond differently to changes in rate expectations.


    Why Are Futures Green but the Market Opens Red?

    This is one of the most confusing situations for beginners.

    There are several reasons it can happen.

    New information arrives

    Futures may move again before the opening bell after an earlier quote was observed.

    The opening auction changes the picture

    Once regular stock trading begins, a large amount of new buying and selling activity enters the market.

    Futures and cash indexes are different markets

    A futures contract is not identical to the cash index.

    Their prices have a specific relationship that can be affected by financing, dividends and other factors.

    Overnight liquidity can differ from regular-session liquidity

    Overnight markets can have different trading conditions from the regular U.S. stock session.

    As a result, an overnight move should not be treated as an irreversible signal.


    What Does Futures Volume Tell You?

    Volume can add context to a futures move.

    A price move accompanied by meaningful trading activity may deserve closer attention than a small move occurring during a thin period.

    CME provides equity-index futures data that includes information such as volume, price changes and market depth.

    However, volume should not be interpreted in isolation.

    A better checklist is:

    • How large is the price move?
    • What caused it?
    • Are ES, NQ and YM aligned?
    • Is the move holding?
    • Is important economic data still ahead?
    • What does the cash-index relationship indicate?

    How to Tell if the Market May Open Higher or Lower

    A simple framework can help.

    Potentially higher opening conditions

    You might see:

    • ES above the previous reference
    • NQ above its reference
    • YM above its reference
    • A meaningful but explainable catalyst
    • The move holding over time
    • No major conflicting news immediately ahead

    Potentially lower opening conditions

    You might see:

    • ES below the previous reference
    • NQ below its reference
    • YM below its reference
    • A clear negative catalyst
    • The move remaining intact
    • No major event expected to reverse the market before the open

    These conditions describe the pre-market setup, not a forecast of the entire session.


    Do Stock Futures Predict the Stock Market?

    No. Stock futures provide an early indication of overnight pricing and potential opening conditions, but they do not reliably predict the direction of the entire stock-market session.

    Futures can move because of information available overnight. Once regular trading starts, however, new orders, liquidity, economic data, company-specific developments and changing expectations can alter prices.

    Think of futures as a pre-market information source, not a crystal ball.


    How to Check Stock Futures Before the Market Opens

    You can check stock futures through financial-market data platforms, broker platforms and other services that display futures quotes.

    When checking them, don’t just search for the words “futures up” or “futures down.”

    Instead, record:

    1. ES direction
    2. NQ direction
    3. YM direction
    4. RTY direction if relevant
    5. Percentage change
    6. Point change
    7. Overnight high/low
    8. Trading activity
    9. Major news catalyst
    10. Important economic releases still ahead
    11. Potential implied opening level

    This gives you a much more complete picture.


    A Simple 5-Minute Pre-Market Futures Checklist

    If you want a repeatable process, use this checklist.

    1. Start with ES

    Is the broad U.S. equity-index futures market higher, lower or nearly unchanged?

    2. Check NQ and YM

    Are they confirming ES or moving differently?

    3. Measure the move

    Look at both points and percentage change.

    4. Find the reason

    Check whether the move is connected to:

    • Economic data
    • Earnings
    • Federal Reserve news
    • Global markets
    • Interest rates
    • Major company news

    5. Check what happens next

    Look for additional scheduled events before the open and see whether the futures move is holding.

    This simple routine can help you avoid reacting to a single headline or isolated futures number.


    Common Mistakes When Reading Stock Futures

    Looking at Only One Index

    ES may be higher while NQ and YM are flat or lower.

    Always check the broader picture.

    Focusing Only on Points

    A 50-point move means different things depending on the index level.

    Use percentage change as well.

    Assuming Green Futures Mean a Green Day

    The opening direction can change.

    The futures market is information, not certainty.

    Ignoring the Catalyst

    A futures move without understanding its cause can be misleading.

    Ask what changed.

    Ignoring Scheduled Economic Data

    If an important economic report is due before the opening bell, the current futures price may change significantly after the release.

    Treating Overnight Prices as Final

    Futures continue moving.

    The number you see several hours before the open may not be the number immediately before the open.

    Confusing Futures With the Cash Index

    Futures and the underlying cash index are related but not identical.

    Understanding their relationship is essential when interpreting the implied open.


    Stock Futures vs. the Regular Stock Market

    FeatureStock FuturesRegular Stock Market
    TracksMajor indexes/contractsIndividual stocks and ETFs
    Trading hoursMuch longerRegular exchange session
    Overnight reactionYesGenerally limited outside regular hours
    Main use before openMarket contextNot yet in regular session
    Price relationshipLinked to underlying indexesActual cash-equity prices
    Predicts entire day?NoNo

    The key takeaway is that futures provide an earlier view of market pricing, not a guaranteed roadmap for the session.


    What Futures Can and Cannot Tell You

    Futures Can Help ShowFutures Cannot Guarantee
    Overnight market directionFull-day market direction
    Potential opening toneFinal closing price
    Relative strength between indexesWhich individual stock will rise
    Reaction to overnight newsHow long a move will last
    Potential gap conditionsWhether a gap will continue
    Changes in market expectationsWhat investors will do after the open

    This distinction is important because it prevents a useful indicator from becoming an unreliable prediction tool.


    Frequently Asked Questions

    What do stock market futures tell you before the open?

    Stock market futures show how major equity-index futures are currently trading before the regular U.S. stock market opens. Their direction and percentage changes can provide context about the potential opening tone, but they do not guarantee the market’s direction for the full session.

    How do I read stock futures before the market opens?

    Start with ES, then compare NQ and YM. Check their percentage changes, identify the reason for the overnight move, review important economic events, and consider the relationship between futures and the underlying cash indexes.

    What are the best futures to watch before the market opens?

    For a broad U.S. equity-market view, ES, NQ and YM are commonly watched. RTY can add information about smaller-company stocks and help you see whether market conditions extend beyond large-cap indexes. CME lists futures for all four major U.S. benchmarks.

    How do I read S&P 500 futures?

    Look at the current ES price, its point and percentage change, the reason for the move, and how it compares with NQ and YM. Then consider the potential implied opening level rather than treating the futures price as a guaranteed prediction.

    How do I read Nasdaq futures before the open?

    Look at NQ’s percentage and point change and compare it with ES and YM. If NQ is moving substantially differently from the broader indexes, investigate whether technology stocks, interest rates or company-specific news could be driving the difference.

    How do I read Dow futures?

    Look at YM’s direction and percentage change, then compare it with ES and NQ. Because the Dow represents a narrower group of large companies, its movement may differ from broader or technology-heavy indexes.

    What does it mean when futures are green?

    Green futures generally mean the futures contract is trading above the relevant previous reference level. This can indicate stronger overnight pricing, but it does not guarantee that the stock market will remain higher after the open.

    Do futures predict the stock market?

    No. Futures can provide useful information about overnight pricing and potential opening conditions, but they do not reliably predict the entire trading session.

    Why do futures sometimes reverse at the open?

    The regular stock market introduces new orders, liquidity and information when trading begins. That can cause prices to move differently from the overnight futures signal.

    What is an implied open?

    An implied open is an estimate of where an underlying stock-market index may begin regular trading based on futures pricing and its relationship with the cash market.


    Final Takeaway

    Learning how to read stock market futures before the open is less about memorizing whether green means “up” and red means “down.”

    The useful information comes from putting several pieces together.

    Start with ES for the broad market. Compare it with NQ and YM to see whether the move is widespread or concentrated. Look at the percentage change, investigate the overnight catalyst, consider volume and liquidity, and understand the difference between futures prices, fair value and the potential implied open.

    Most importantly, treat futures as pre-market context rather than a guaranteed prediction.

    That approach gives you a clearer framework for understanding what the market is pricing before the opening bell without assuming that the overnight move will determine the entire trading day.
  • How to Read Stock Charts: A Beginner’s Step-by-Step Guide

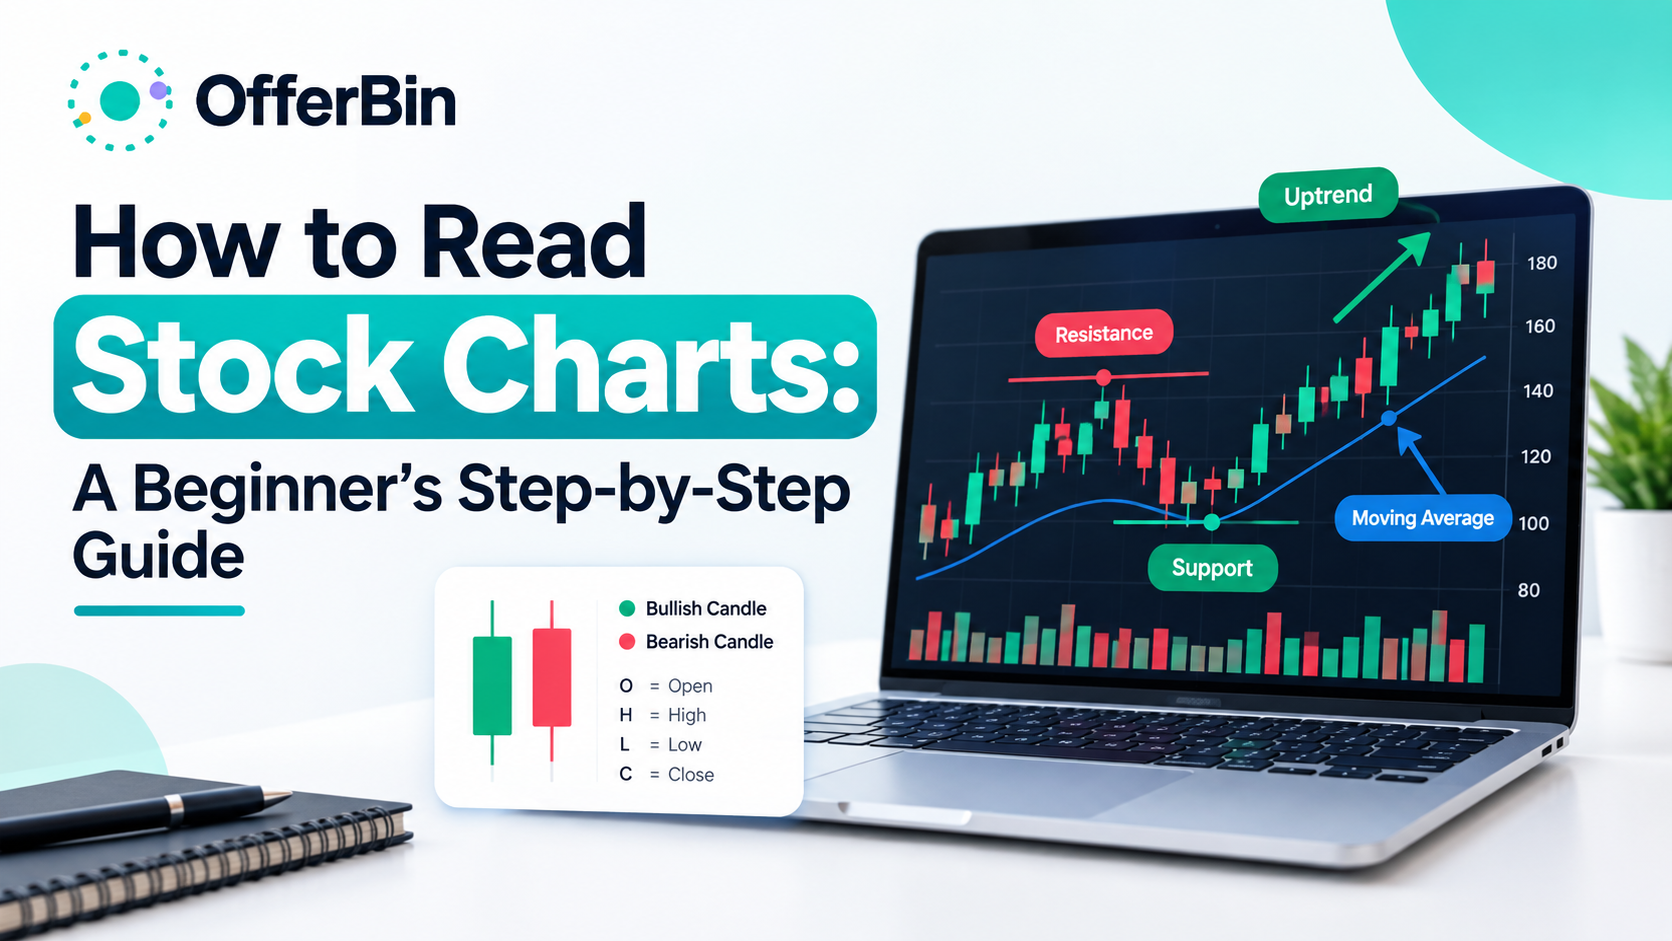
    How to Read Stock Charts: A Beginner’s Step-by-Step Guide

    A stock chart shows how a stock’s price has moved over a period of time. To read one, start with the timeframe and overall trend, then examine price levels, candlesticks, trading volume, and selected indicators. The goal is to understand what the chart is showing—not to assume it can predict exactly what happens next.

    If you’re new to stock charts, the amount of information on a typical chart can look overwhelming. Lines, candles, numbers, volume bars, indicators, and patterns can all appear at once.

    The good news is that you don’t need to understand everything immediately.

    A practical way to read a stock chart is to work through it in a consistent order:

    Timeframe → Trend → Key levels → Volume → Candlesticks → Indicators → Patterns → Context

    This guide explains each step in plain language and shows how the different pieces fit together.

    What Is a Stock Chart?

    A stock chart is a visual representation of a stock’s price movement over time. Depending on the chart type, it can also show information such as the opening price, highest price, lowest price, closing price, and trading volume.

    Most stock charts have two basic axes:

    • Horizontal axis: represents time.
    • Vertical axis: represents price.

    For example, a daily chart may show one trading day at a time, while an intraday chart could show price movement minute by minute.

    A chart helps you see historical price behavior quickly. It can show whether price has generally moved upward, downward, or sideways and where important price levels have developed.

    However, a chart does not contain every factor that can affect a stock. Company earnings, economic conditions, interest rates, news, management decisions, valuation, and other fundamental factors may also influence prices.

    How to Read a Stock Chart Step by Step

    You can make stock chart analysis much easier by following the same sequence every time.

    Start With the Timeframe

    Before interpreting a chart, check its timeframe.

    A chart can look completely different depending on whether you’re viewing:

    • One-minute candles
    • Five-minute candles
    • One-hour candles
    • Daily candles
    • Weekly candles
    • Monthly candles

    A short timeframe shows smaller price movements, while a longer timeframe can make broader trends easier to see.

    For beginners, starting with a daily or weekly chart can make it easier to understand the bigger picture before looking at shorter-term movements.

    Check the Overall Trend

    Next, ask a simple question:

    Is the stock moving generally upward, downward, or sideways?

    An uptrend commonly features a sequence of higher highs and higher lows.

    A downtrend commonly features lower highs and lower lows.

    A sideways market moves within a relatively defined range without a clear sustained upward or downward direction.

    Don’t determine the trend from one candle. Look at a meaningful section of the chart and consider how the sequence of highs and lows is developing.

    Identify Support and Resistance

    After identifying the trend, look for important price areas.

    Support is an area where buying interest has previously helped slow or stop a decline.

    Resistance is an area where selling pressure has previously helped slow or stop an advance.

    These are better understood as zones rather than perfectly precise lines. Price can move slightly through a level before reversing, and previous support can sometimes become resistance after a breakdown.

    Look at Trading Volume

    Volume tells you how many shares changed hands during a particular period.

    Price and volume can provide useful context when viewed together.

    For example:

    • Rising price with increasing volume can indicate stronger participation.
    • A price move on unusually low volume may deserve additional scrutiny.
    • High volume during a breakout can provide additional context.
    • A sudden volume spike can accompany important news or significant price movement.

    Volume does not automatically confirm that a move will continue. It is one piece of information among several.

    Read the Latest Candlesticks

    Once you understand the broader trend, examine the latest candles.

    Look at:

    • Candle direction
    • Candle body size
    • Upper wick
    • Lower wick
    • Position relative to recent price levels
    • Volume during the move

    A single candle rarely provides enough information by itself. Its meaning depends heavily on where it appears on the chart and what price was doing beforehand.

    Check a Small Number of Indicators

    Indicators can help organize price information, but more indicators do not necessarily produce better analysis.

    Common examples include:

    • Moving averages
    • Relative Strength Index (RSI)
    • Moving Average Convergence Divergence (MACD)

    For beginners, it can be more useful to understand one or two indicators properly than to place a large collection of indicators on the same chart.

    Look for Chart Patterns

    Finally, you can consider whether a recognizable chart pattern is developing.

    Examples include:

    • Double tops
    • Double bottoms
    • Head and shoulders
    • Triangles
    • Flags

    Patterns should be treated as potential interpretations rather than guaranteed forecasts. Context, volume, timeframe, and the broader market can all affect how a pattern develops.

    Stock Chart Types Explained

    Different chart types present price information in different ways.

    Chart typeWhat it showsBest use
    Line chartUsually closing prices connected over timeSeeing the broad trend
    Bar chartOpen, high, low and closeDetailed price analysis
    Candlestick chartOpen, high, low and close in an easy-to-read visual formatPrice action and chart analysis

    Line Charts

    Line charts are among the simplest stock charts.

    A line connects a series of prices—often closing prices—to show how the stock moved over time.

    They’re useful when you want to quickly see the overall direction without being distracted by individual intraday movements.

    Bar Charts

    A traditional price bar contains information about the stock’s:

    • Open
    • High
    • Low
    • Close

    This is commonly abbreviated as OHLC.

    The bar’s high and low show the trading range for that period, while small horizontal marks indicate the opening and closing prices.

    Candlestick Charts

    Candlestick charts contain the same basic OHLC information but present it in a more visual format.

    Each candle can quickly show:

    • Where price opened
    • Where price closed
    • The highest price reached
    • The lowest price reached

    This makes candlestick charts particularly popular for technical analysis.

    How to Read Candlestick Charts

    A candlestick has two main visual components:

    Body: shows the relationship between the opening and closing prices.

    Wicks or shadows: show prices reached above and below the candle’s body.

    The exact colors depend on the charting platform, but many platforms use green for a period where the closing price was higher than the opening price and red for a period where the closing price was lower.

    What Do Green and Red Candles Mean?

    A green candle generally means the closing price was above the opening price for that period.

    A red candle generally means the closing price was below the opening price.

    The color alone does not tell you what happens next.

    For example, a large green candle near resistance can mean something very different from a large green candle breaking above a long-established trading range.

    What Do the Wicks Mean?

    The upper wick shows how high price moved during the period before closing.

    The lower wick shows how low price moved.

    Long wicks can show that price moved significantly away from the eventual closing area during that period.

    Again, context matters. A long lower wick near a support zone has a different context from a long lower wick during a strong downtrend.

    How to Identify Trends on Stock Charts

    Trend analysis is one of the most useful starting points when reading a stock chart.

    Uptrend

    An uptrend generally develops through a series of:

    Higher highs + higher lows

    The stock is repeatedly reaching higher price levels while pullbacks are holding above previous lows.

    Downtrend

    A downtrend generally develops through:

    Lower highs + lower lows

    Rallies fail to reach previous highs, while declines continue to establish lower lows.

    Sideways Trend

    A stock may also trade sideways.

    In this situation, price repeatedly moves between a relatively defined upper and lower area without establishing a sustained directional trend.

    Sideways markets are sometimes described as ranges or consolidations.

    Why Higher Highs and Higher Lows Matter

    Looking at highs and lows can be more useful than simply asking whether a stock is “going up.”

    A stock may rise sharply for several days but still be part of a broader downtrend if its longer-term structure continues to produce lower highs and lower lows.

    This is why timeframe matters.

    Support and Resistance Explained

    Support and resistance are common concepts in stock chart analysis.

    What Is Support?

    Support is a price area where previous selling pressure has been met by enough buying activity to slow or reverse a decline.

    Support isn’t guaranteed to hold.

    If selling pressure becomes strong enough, price can move below the area.

    What Is Resistance?

    Resistance is a price area where previous upward movement has encountered selling pressure.

    A stock can break above resistance, remain below it, or briefly move above it and then fall back.

    How to Identify Support and Resistance on a Chart

    Look for areas where price has repeatedly:

    • Reversed upward
    • Reversed downward
    • Paused before continuing
    • Consolidated
    • Reacted strongly

    The more frequently price reacts around an area, the more noticeable that zone may become.

    But there is no universal rule that makes a particular support or resistance level certain to hold.

    Support and Resistance Zones

    It’s often better to think in terms of zones rather than exact numbers.

    For example, if a stock repeatedly reacts between $48 and $50, treating $49.00 as an exact dividing line may create a false sense of precision.

    A broader zone can better represent the historical price behavior.

    How to Read Stock Volume

    Volume measures the number of shares traded during a particular period.

    It is usually displayed below the main price chart as vertical bars.

    Volume can help provide context for price movements.

    Rising Price and Volume

    If price rises while volume also increases, the move is occurring alongside greater trading activity.

    That may provide useful confirmation, but it does not guarantee that the trend will continue.

    Falling Price and Volume

    A decline accompanied by elevated volume can indicate significant participation during the move.

    Again, the information should be interpreted alongside the broader trend and price structure.

    Volume During Breakouts

    Volume is often watched when price moves beyond an established resistance or support area.

    A breakout accompanied by noticeably higher volume may attract more attention than a move through the same level on unusually low volume.

    However, breakouts can fail.

    A move above resistance that quickly falls back into the previous range is sometimes described as a false breakout.

    Moving Averages and Other Stock Chart Indicators

    Indicators transform or organize price and volume data to help traders examine particular aspects of market behavior.

    They should not be treated as automatic buy or sell signals.

    Simple Moving Average

    A Simple Moving Average (SMA) calculates the average price over a specified number of periods.

    For example, a 50-day SMA uses the prices from the relevant 50 trading days to calculate an average that changes as new data arrives.

    Moving averages can help smooth short-term price fluctuations and make broader trends easier to observe.

    Exponential Moving Average

    An Exponential Moving Average (EMA) gives greater weight to more recent prices than a simple moving average.

    As a result, it can respond more quickly to recent price changes.

    Relative Strength Index

    The Relative Strength Index (RSI) is a momentum indicator commonly displayed on a scale from 0 to 100.

    It is often used to assess the strength of recent price movements and identify potentially overextended conditions.

    An RSI reading should not be interpreted in isolation or treated as proof that a stock must reverse.

    MACD

    The Moving Average Convergence Divergence (MACD) is another momentum and trend-related indicator.

    It compares moving averages and can help users examine changes in momentum and trend behavior.

    As with other indicators, the MACD is most useful when understood in the context of the underlying price action.

    Avoid Indicator Overload

    A common beginner mistake is adding many indicators because the chart looks more sophisticated.

    More information can actually make a chart harder to interpret.

    Start with the basic price structure. Add an indicator only when you understand what question it is helping you answer.

    Common Stock Chart Patterns

    Chart patterns describe recurring formations in price data.

    They can be useful for organizing what you see, but patterns are not guarantees of future price direction.

    Double Top

    A double top occurs when price reaches a similar high on two occasions and struggles to move beyond the area.

    The pattern is generally interpreted in the context of what happens after the second attempt.

    Double Bottom

    A double bottom is broadly the opposite structure, where price tests a similar low twice before moving away from the area.

    Head and Shoulders

    A head-and-shoulders structure typically contains:

    • A first peak
    • A higher central peak
    • A third peak that is lower than the central peak

    The lows between these peaks are often connected conceptually by a neckline.

    Triangles

    Triangle patterns form when price moves within converging boundaries.

    Common descriptions include:

    • Ascending triangle
    • Descending triangle
    • Symmetrical triangle

    The eventual direction is not guaranteed simply because a triangle appears.

    Flags

    Flag patterns are generally short-term consolidation structures that occur after a noticeable price movement.

    As with all chart patterns, context is important.

    A Simple Stock Chart Analysis Example

    Imagine you’re looking at a hypothetical daily stock chart.

    The first thing you notice is that price has been producing higher highs and higher lows over several weeks.

    That suggests an upward trend.

    Next, you identify a price zone where previous pullbacks stopped. That becomes an area of potential support.

    You also identify a higher price area where previous advances struggled. That’s a potential resistance zone.

    Then you examine volume.

    The latest upward move occurred with higher-than-usual volume, giving you additional information about participation during the move.

    You then inspect the most recent candles. Instead of focusing on one candle, you compare the latest candles with the surrounding price action.

    Finally, you look at a moving average to see whether it provides useful additional context.

    The result is not a prediction.

    Instead, you’ve built a structured description of the chart:

    • Timeframe: Daily
    • Trend: Upward
    • Structure: Higher highs and higher lows
    • Support: Identified below recent price
    • Resistance: Identified above recent price
    • Volume: Elevated during the recent move
    • Candles: Reviewed in context
    • Indicator: Used as supporting information

    This is a much more useful way to approach stock chart analysis than trying to find one “magic” signal.

    Common Mistakes Beginners Make

    Looking at Only One Candle

    One candle rarely explains the entire market structure.

    Always consider surrounding price action.

    Ignoring the Timeframe

    A stock can look bullish on a five-minute chart while looking bearish on a weekly chart.

    Always know which timeframe you’re analyzing.

    Using Too Many Indicators

    A chart covered in indicators can create confusion rather than clarity.

    Start with price and volume before adding additional tools.

    Treating Patterns as Guarantees

    A chart pattern is an interpretation of historical price behavior.

    It is not a guarantee of future performance.

    Ignoring Volume

    Price can tell you where the market moved. Volume can provide additional context about trading activity during that move.

    Assuming Support or Resistance Must Hold

    Support and resistance are areas of historical price reaction, not permanent barriers.

    Confusing Technical Analysis With Fundamental Analysis

    A chart primarily shows market data such as price and volume.

    It does not automatically tell you:

    • Whether a company is profitable
    • Whether its valuation is attractive
    • Whether revenue is growing
    • Whether management is effective
    • Whether a product will succeed

    Those questions require other forms of research.

    Stock Chart Reading Checklist

    Before drawing conclusions from a stock chart, ask:

    • What timeframe am I viewing?
    • What does the broader trend look like?
    • Are highs and lows rising or falling?
    • Where are the major support zones?
    • Where are the major resistance zones?
    • What is trading volume doing?
    • What do the latest candlesticks show?
    • Is there a recognizable chart pattern?
    • Are indicators actually adding useful information?
    • Is the broader market affecting the stock?
    • Am I interpreting a possibility as if it were a certainty?
    • What important information isn’t visible on the chart?

    This checklist can help prevent you from focusing too heavily on one signal.

    Can Stock Charts Predict Future Prices?

    No chart can guarantee what a stock will do next.

    Stock charts are primarily tools for examining historical price and volume behavior. Technical analysis can help users identify trends, levels, patterns and changes in momentum, but those observations do not remove uncertainty.

    Future prices can be affected by information that isn’t visible on a chart, including company results, economic data, interest rates, news, regulations and unexpected events.

    For that reason, chart analysis is better understood as a method of interpreting market data than as a reliable prediction machine.

    Technical Analysis vs. Fundamental Analysis

    Technical and fundamental analysis approach markets from different angles.

    Technical analysisFundamental analysis
    Focuses heavily on price and volumeFocuses on business and economic factors
    Uses charts and indicatorsUses financial statements, valuation and business information
    Examines historical market behaviorExamines underlying financial and economic conditions
    Often emphasizes trends and patternsOften emphasizes earnings, cash flow and valuation

    These approaches don’t necessarily have to be treated as mutually exclusive. They answer different questions.

    How to Get Better at Reading Stock Charts

    The best way to improve is to practice interpreting charts systematically.

    Start with the basics:

    1. Choose a timeframe.
    2. Identify the overall trend.
    3. Mark obvious support and resistance zones.
    4. Examine volume.
    5. Read the latest candlesticks.
    6. Add only the indicators you understand.
    7. Look for patterns.
    8. Write down what the chart actually shows.
    9. Separate observations from assumptions.
    10. Review what happened afterward without changing your original interpretation.

    That last step is especially useful for learning. It helps you evaluate whether your interpretation was supported by the information available at the time rather than judging it only from hindsight.

    FAQs About Reading Stock Charts

    How do you read stock charts for beginners?

    Start by identifying the timeframe and overall trend. Then examine higher highs and lower lows, support and resistance, trading volume, candlesticks and a small number of useful indicators. Focus on the complete price structure rather than trying to interpret one candle or indicator in isolation.

    What do the lines on a stock chart mean?

    Lines can represent different types of information. The main price line may connect closing prices, while other lines may represent moving averages, trendlines, support or resistance. Always check the chart legend or indicator label to determine exactly what a particular line represents.

    What do green and red candles mean?

    On many charting platforms, a green candle means the closing price was higher than the opening price, while a red candle means the closing price was lower than the opening price. Color conventions can vary, so check your charting platform’s settings.

    What are OHLC prices?

    OHLC stands for Open, High, Low and Close. These four values describe the opening price, highest price, lowest price and closing price for a specific trading period.

    How do you identify an uptrend?

    An uptrend generally features a sequence of higher highs and higher lows. Rather than relying on one upward move, look at the broader structure of the chart and consider the timeframe you’re analyzing.

    How do you identify support and resistance?

    Look for price areas where the stock has repeatedly paused, reversed or struggled to move through. Support generally refers to areas where declines have previously slowed, while resistance refers to areas where advances have previously encountered selling pressure.

    What does volume tell you on a stock chart?

    Volume shows how many shares were traded during a particular period. It can provide context for price movements, including whether a breakout or decline occurred alongside unusually high trading activity.

    What is the best timeframe for reading stock charts?

    There is no single best timeframe for everyone. The appropriate timeframe depends on the question being analyzed. Longer timeframes can help reveal broader trends, while shorter timeframes show more detailed price movements.

    Which indicators should beginners use?

    Beginners can start by understanding basic tools such as moving averages, RSI and MACD. The important point is not to use as many indicators as possible, but to understand what each indicator measures and how it complements the price chart.

    Can stock charts predict stock prices?

    No. Charts can help analyze historical price and volume behavior, but they cannot guarantee future price movements. Market prices can change because of company-specific, economic, political, regulatory and other unexpected factors.

    Final Takeaway

    Learning how to read stock charts becomes easier when you stop trying to interpret everything at once.

    Start with the timeframe, then examine the trend, support and resistance, volume, and candlesticks. After that, use indicators and chart patterns as supporting information rather than treating them as guaranteed signals.

    The most useful question isn’t simply, “What pattern is this?”

    It’s:

    “What is the chart actually showing, what evidence supports that interpretation, and what remains uncertain?”

    That approach can help you read stock charts more systematically while avoiding many of the common mistakes beginners make.