Author: Muhammad Bilal

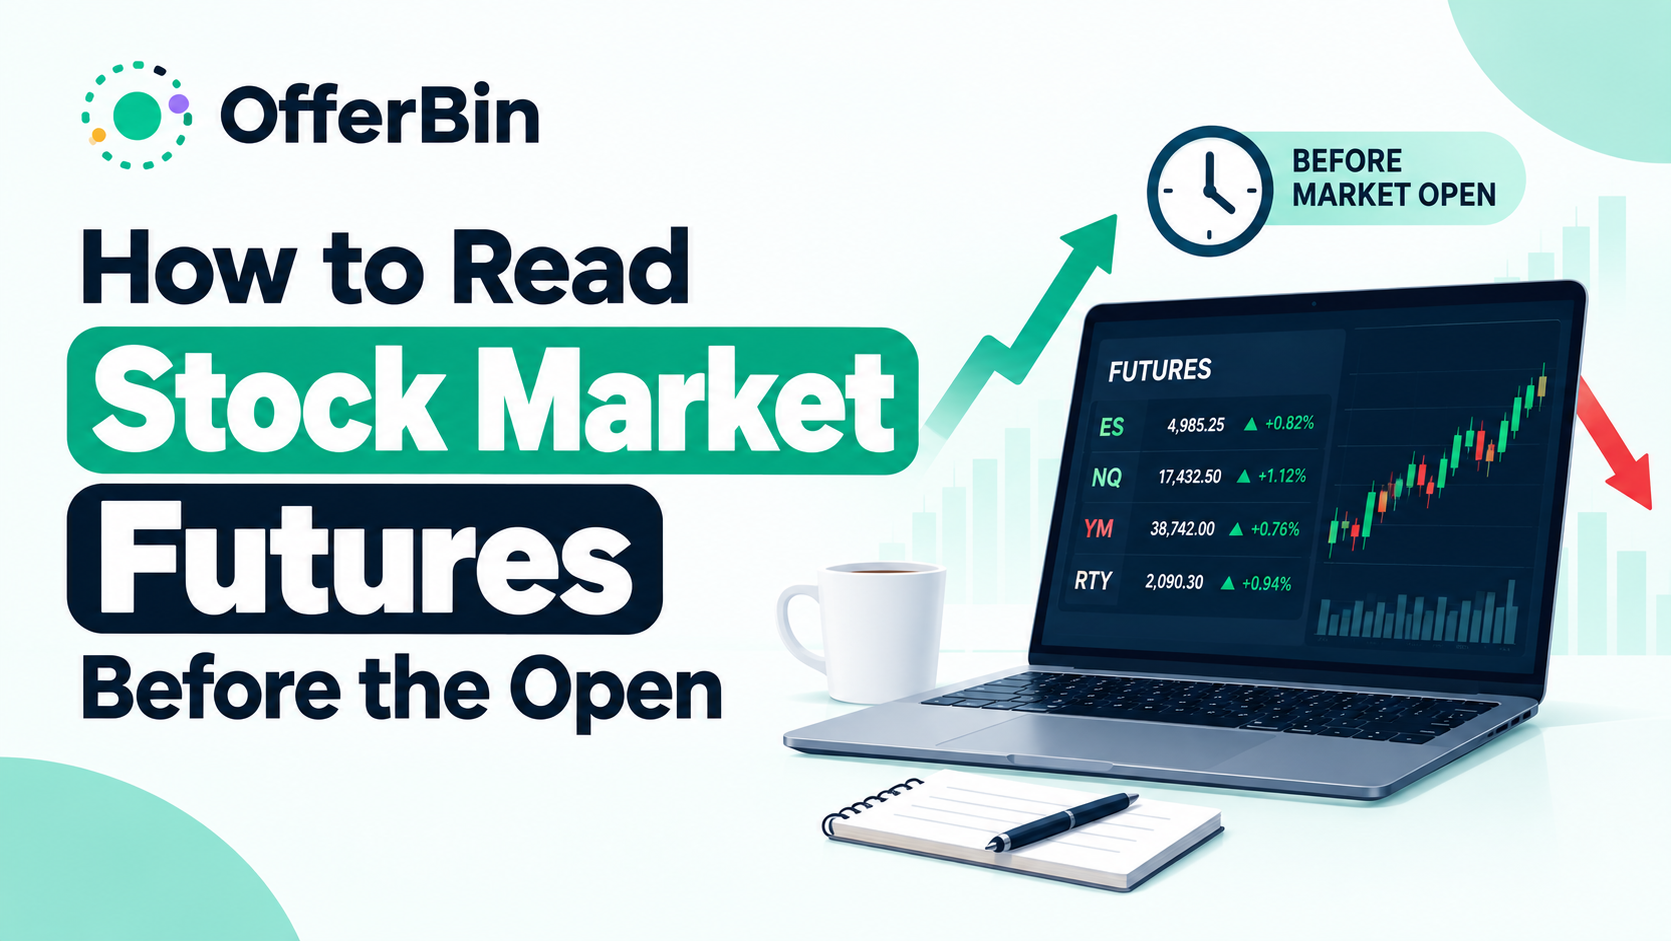
  • How to Read Stock Market Futures Before the Open

    How to Read Stock Market Futures Before the Open

    If you want an early read on how the U.S. stock market may open, stock market futures are one of the first places to look.

    Futures such as the S&P 500, Nasdaq-100, and Dow Jones contracts trade outside regular stock-market hours, allowing prices to respond to overnight news, economic developments, earnings announcements, and global market moves. CME Group lists futures across major U.S. equity benchmarks including the S&P 500, Nasdaq-100, Dow Jones and Russell 2000.

    But there is an important distinction: futures can provide context about the potential market open, but they do not guarantee what stocks will do after the opening bell.

    To read stock futures properly, you need to look beyond whether the numbers are simply green or red. You should compare the major contracts, measure the size of their moves, understand what caused the move, and check whether the signal is broad or concentrated.

    What Are Stock Market Futures?

    Stock market futures are contracts based on major stock-market indexes. Instead of representing ownership of individual companies, equity-index futures provide exposure to the movement of an underlying index.

    The major U.S. equity-index futures include contracts based on:

    • S&P 500
    • Nasdaq-100
    • Dow Jones Industrial Average
    • Russell 2000

    These markets trade for much longer hours than the regular U.S. stock market, giving participants a way to react to information while the cash equity market is closed. CME describes its U.S. equity-index futures markets as providing around-the-clock access across major benchmarks.

    That makes futures useful for answering a simple pre-market question:

    What is the market pricing in right now before regular stock trading begins?

    For more market-information resources, you can also explore OfferBin.

    Why Do Stock Futures Matter Before the Market Opens?

    During the regular session, stocks trade on exchanges and prices continuously respond to new information.

    Before the U.S. cash market opens, however, major news can still arrive.

    For example:

    • A company can release earnings.
    • An economic report can change expectations about interest rates.
    • Federal Reserve officials can make important comments.
    • European or Asian markets can move sharply.
    • Geopolitical developments can change risk sentiment.
    • Bond yields or other major financial markets can move.

    Equity-index futures can react to these developments before the regular U.S. stock session begins.

    That is why financial headlines often report statements such as “S&P futures are higher” or “Nasdaq futures are lower.”

    The important point is that the futures move is an early market signal, not a guaranteed forecast for the entire trading session.


    Which Stock Futures Should You Watch?

    Three contracts are particularly useful for understanding the broad U.S. market:

    FuturesUnderlying IndexWhat It Helps You Understand
    ESS&P 500Broad large-cap U.S. market
    NQNasdaq-100Technology and growth-heavy exposure
    YMDow Jones Industrial AverageLarge established blue-chip companies
    RTYRussell 2000Smaller U.S. companies

    CME offers equity-index futures covering these major benchmarks, including E-mini and Micro E-mini contracts.

    S&P 500 Futures (ES)

    ES, commonly referring to E-mini S&P 500 futures, tracks the S&P 500.

    Because the S&P 500 covers a broad group of large U.S. companies across multiple sectors, ES is often useful as a broad indicator of U.S. equity-market direction.

    Nasdaq-100 Futures (NQ)

    NQ tracks the Nasdaq-100.

    The Nasdaq-100 has substantial exposure to large technology and growth-oriented companies, so NQ can behave differently from broader index futures when technology stocks are driving the market.

    Dow Jones Futures (YM)

    YM represents futures linked to the Dow Jones Industrial Average.

    The Dow contains 30 large companies, so it represents a narrower part of the U.S. equity market than the S&P 500.

    Russell 2000 Futures (RTY)

    RTY tracks the Russell 2000 and provides additional information about smaller U.S. companies.

    Adding RTY to your pre-market review can help you determine whether a move is concentrated in large-cap indexes or appears more broadly distributed across different segments of the market.


    How to Read Stock Market Futures Before the Open

    A useful pre-market process is:

    Check direction → measure the move → compare indexes → identify the catalyst → check the potential open → reassess before the bell

    Here is how each step works.

    Check the Direction of the Futures

    Start by looking at the current futures price relative to the relevant previous reference point.

    If futures are higher, the contracts are indicating stronger overnight pricing.

    If futures are lower, the contracts are indicating weaker overnight pricing.

    For example:

    Futures MoveBasic Interpretation
    ES +0.05%Almost unchanged
    ES +0.50%Moderately higher
    ES +1.50%Significant overnight move
    ES -0.25%Slightly lower
    ES -1.00%Meaningful overnight weakness

    These figures are examples, not fixed thresholds.

    The size of a move matters because a futures contract being up 0.05% tells you something very different from one being up 1.5%.


    Look at the Percentage Change, Not Just Points

    One of the easiest mistakes is focusing only on the number of points.

    Suppose a futures contract is 50 points higher.

    That sounds significant until you consider the index level.

    A better approach is to look at:

    • Current futures price
    • Previous reference price
    • Point change
    • Percentage change

    Percentage change makes it easier to compare the magnitude of movements across different indexes.

    For example:

    Previous level: 5,000
    Current level: 5,025
    Point change: +25
    Percentage change: +0.50%

    The percentage figure immediately tells you that the move represents roughly half of one percent.


    Compare ES, NQ and YM

    Don’t rely on one futures contract.

    Look at the major indexes together.

    For example:

    ESNQYMWhat It May Suggest
    UpUpUpBroad overnight strength
    UpStronger UpFlatTechnology/growth leadership
    FlatUpDownMixed market conditions
    DownDownDownBroad overnight weakness
    UpDownFlatDivergent market

    These are interpretations, not predictions.

    The value comes from identifying relationships between the contracts.

    If ES, NQ and YM are all moving in the same direction, the overnight signal is broader.

    If one index moves sharply while another barely moves, the market may be reacting to a specific sector, company group, interest-rate change, or other catalyst.


    What Does It Mean When Stock Futures Are Up?

    When stock futures are higher before the open, they indicate that the futures market is currently pricing at higher levels than the relevant previous reference.

    That can suggest a stronger potential opening tone.

    But don’t automatically translate:

    Futures up → stocks will stay up all day.

    That conclusion goes too far.

    Futures can change before the open, and the regular stock market can introduce new liquidity, orders and information once trading begins.

    A better interpretation is:

    Higher futures indicate stronger overnight pricing and may point toward a higher opening level, but they do not establish the direction of the entire trading session.

    The same principle applies when futures are lower.


    How Do Futures Indicate Whether the Market May Open Higher or Lower?

    The basic idea is straightforward.

    If the futures market is pricing an index above its relevant cash-market reference, that can indicate a higher potential opening level.

    If futures are below that reference, it can indicate a lower potential opening level.

    For example, imagine:

    • Previous S&P 500 close: 6,000
    • Current futures-implied level: 6,030

    The market would be indicating a potential opening around 30 points higher than the previous close.

    However, the exact relationship between futures and the cash index is more complicated than simply comparing two numbers.

    That’s where fair value becomes important.


    What Is Fair Value?

    Fair value is a theoretical relationship between the futures contract and its underlying cash index that accounts for factors such as financing costs and expected dividends over the relevant period.

    You usually don’t need to calculate fair value manually.

    Market-data services can provide fair-value information alongside futures and index data.

    This matters because the raw futures price isn’t always enough to understand the expected opening relationship.

    For example, suppose:

    • The S&P 500 closed at 6,000
    • Futures are trading 25 points higher
    • Fair value indicates a different theoretical relationship

    The futures price should therefore be interpreted alongside the relevant cash-index and fair-value information rather than in isolation.


    What Is an Implied Open?

    The implied open is an estimate of where an underlying market index may begin regular trading based on available futures information and the relationship between futures and the cash market.

    It is an estimate, not a guaranteed opening print.

    The implied level can change right up until the regular market opens because futures prices continue moving.

    This is why a headline you see early in the morning may not match the final opening level.

    A useful mental model is:

    Futures → relationship with cash index/fair value → potential opening level

    Not:

    Futures → guaranteed opening price


    How to Read ES, NQ and YM Together

    Looking at the three major contracts together can reveal more information than watching a single futures quote.

    When ES, NQ and YM Are All Higher

    If all three are higher, the overnight move appears broader across major U.S. equity benchmarks.

    That doesn’t guarantee a strong regular session, but it provides a more consistent pre-market signal than one index moving alone.

    When NQ Is Much Stronger Than ES

    A stronger NQ relative to ES can indicate that technology and growth-oriented stocks are contributing more to the overnight move.

    You would then want to look at what is driving technology-related sentiment.

    Possible catalysts include:

    • Major technology earnings
    • Interest-rate expectations
    • Bond-yield changes
    • Semiconductor news
    • Large technology-company announcements

    When YM Is Stronger Than NQ

    A stronger Dow futures contract with weaker Nasdaq futures can indicate a different market leadership pattern.

    This may occur when investors are responding differently to sectors represented more heavily in the Dow compared with technology-heavy parts of the market.

    When the Futures Diverge

    Divergence means the contracts are not moving together.

    For example:

    • ES +0.2%
    • NQ -0.4%
    • YM +0.1%

    That’s a mixed signal.

    Rather than forcing a bullish or bearish interpretation, ask:

    Why is Nasdaq futures behaving differently?

    That question can lead you toward the actual catalyst.


    What Causes Stock Futures to Move Overnight?

    Understanding why futures moved can be more useful than simply knowing that they moved.

    Economic Data

    Important economic releases can move futures rapidly.

    Examples include:

    • Inflation data
    • Employment reports
    • GDP data
    • Retail sales
    • Consumer confidence
    • Manufacturing data

    The market reaction can depend on how the actual result compares with expectations.

    Federal Reserve News

    Interest-rate expectations can have a major effect on equity markets.

    Comments from Federal Reserve officials or changes in expectations around monetary policy can therefore influence index futures.

    Earnings Announcements

    Large publicly traded companies can influence index futures when they report earnings outside regular market hours.

    The effect can be particularly noticeable when the company has a significant weighting in a major index.

    Global Markets

    U.S. futures can also react to movements in major overseas markets.

    European and Asian market developments may affect global risk sentiment before U.S. trading begins.

    Interest Rates and Bond Yields

    Changes in Treasury yields can influence how investors value stocks, particularly growth-oriented companies.

    This is one reason NQ and broader equity futures can sometimes respond differently to changes in rate expectations.


    Why Are Futures Green but the Market Opens Red?

    This is one of the most confusing situations for beginners.

    There are several reasons it can happen.

    New information arrives

    Futures may move again before the opening bell after an earlier quote was observed.

    The opening auction changes the picture

    Once regular stock trading begins, a large amount of new buying and selling activity enters the market.

    Futures and cash indexes are different markets

    A futures contract is not identical to the cash index.

    Their prices have a specific relationship that can be affected by financing, dividends and other factors.

    Overnight liquidity can differ from regular-session liquidity

    Overnight markets can have different trading conditions from the regular U.S. stock session.

    As a result, an overnight move should not be treated as an irreversible signal.


    What Does Futures Volume Tell You?

    Volume can add context to a futures move.

    A price move accompanied by meaningful trading activity may deserve closer attention than a small move occurring during a thin period.

    CME provides equity-index futures data that includes information such as volume, price changes and market depth.

    However, volume should not be interpreted in isolation.

    A better checklist is:

    • How large is the price move?
    • What caused it?
    • Are ES, NQ and YM aligned?
    • Is the move holding?
    • Is important economic data still ahead?
    • What does the cash-index relationship indicate?

    How to Tell if the Market May Open Higher or Lower

    A simple framework can help.

    Potentially higher opening conditions

    You might see:

    • ES above the previous reference
    • NQ above its reference
    • YM above its reference
    • A meaningful but explainable catalyst
    • The move holding over time
    • No major conflicting news immediately ahead

    Potentially lower opening conditions

    You might see:

    • ES below the previous reference
    • NQ below its reference
    • YM below its reference
    • A clear negative catalyst
    • The move remaining intact
    • No major event expected to reverse the market before the open

    These conditions describe the pre-market setup, not a forecast of the entire session.


    Do Stock Futures Predict the Stock Market?

    No. Stock futures provide an early indication of overnight pricing and potential opening conditions, but they do not reliably predict the direction of the entire stock-market session.

    Futures can move because of information available overnight. Once regular trading starts, however, new orders, liquidity, economic data, company-specific developments and changing expectations can alter prices.

    Think of futures as a pre-market information source, not a crystal ball.


    How to Check Stock Futures Before the Market Opens

    You can check stock futures through financial-market data platforms, broker platforms and other services that display futures quotes.

    When checking them, don’t just search for the words “futures up” or “futures down.”

    Instead, record:

    1. ES direction
    2. NQ direction
    3. YM direction
    4. RTY direction if relevant
    5. Percentage change
    6. Point change
    7. Overnight high/low
    8. Trading activity
    9. Major news catalyst
    10. Important economic releases still ahead
    11. Potential implied opening level

    This gives you a much more complete picture.


    A Simple 5-Minute Pre-Market Futures Checklist

    If you want a repeatable process, use this checklist.

    1. Start with ES

    Is the broad U.S. equity-index futures market higher, lower or nearly unchanged?

    2. Check NQ and YM

    Are they confirming ES or moving differently?

    3. Measure the move

    Look at both points and percentage change.

    4. Find the reason

    Check whether the move is connected to:

    • Economic data
    • Earnings
    • Federal Reserve news
    • Global markets
    • Interest rates
    • Major company news

    5. Check what happens next

    Look for additional scheduled events before the open and see whether the futures move is holding.

    This simple routine can help you avoid reacting to a single headline or isolated futures number.


    Common Mistakes When Reading Stock Futures

    Looking at Only One Index

    ES may be higher while NQ and YM are flat or lower.

    Always check the broader picture.

    Focusing Only on Points

    A 50-point move means different things depending on the index level.

    Use percentage change as well.

    Assuming Green Futures Mean a Green Day

    The opening direction can change.

    The futures market is information, not certainty.

    Ignoring the Catalyst

    A futures move without understanding its cause can be misleading.

    Ask what changed.

    Ignoring Scheduled Economic Data

    If an important economic report is due before the opening bell, the current futures price may change significantly after the release.

    Treating Overnight Prices as Final

    Futures continue moving.

    The number you see several hours before the open may not be the number immediately before the open.

    Confusing Futures With the Cash Index

    Futures and the underlying cash index are related but not identical.

    Understanding their relationship is essential when interpreting the implied open.


    Stock Futures vs. the Regular Stock Market

    FeatureStock FuturesRegular Stock Market
    TracksMajor indexes/contractsIndividual stocks and ETFs
    Trading hoursMuch longerRegular exchange session
    Overnight reactionYesGenerally limited outside regular hours
    Main use before openMarket contextNot yet in regular session
    Price relationshipLinked to underlying indexesActual cash-equity prices
    Predicts entire day?NoNo

    The key takeaway is that futures provide an earlier view of market pricing, not a guaranteed roadmap for the session.


    What Futures Can and Cannot Tell You

    Futures Can Help ShowFutures Cannot Guarantee
    Overnight market directionFull-day market direction
    Potential opening toneFinal closing price
    Relative strength between indexesWhich individual stock will rise
    Reaction to overnight newsHow long a move will last
    Potential gap conditionsWhether a gap will continue
    Changes in market expectationsWhat investors will do after the open

    This distinction is important because it prevents a useful indicator from becoming an unreliable prediction tool.


    Frequently Asked Questions

    What do stock market futures tell you before the open?

    Stock market futures show how major equity-index futures are currently trading before the regular U.S. stock market opens. Their direction and percentage changes can provide context about the potential opening tone, but they do not guarantee the market’s direction for the full session.

    How do I read stock futures before the market opens?

    Start with ES, then compare NQ and YM. Check their percentage changes, identify the reason for the overnight move, review important economic events, and consider the relationship between futures and the underlying cash indexes.

    What are the best futures to watch before the market opens?

    For a broad U.S. equity-market view, ES, NQ and YM are commonly watched. RTY can add information about smaller-company stocks and help you see whether market conditions extend beyond large-cap indexes. CME lists futures for all four major U.S. benchmarks.

    How do I read S&P 500 futures?

    Look at the current ES price, its point and percentage change, the reason for the move, and how it compares with NQ and YM. Then consider the potential implied opening level rather than treating the futures price as a guaranteed prediction.

    How do I read Nasdaq futures before the open?

    Look at NQ’s percentage and point change and compare it with ES and YM. If NQ is moving substantially differently from the broader indexes, investigate whether technology stocks, interest rates or company-specific news could be driving the difference.

    How do I read Dow futures?

    Look at YM’s direction and percentage change, then compare it with ES and NQ. Because the Dow represents a narrower group of large companies, its movement may differ from broader or technology-heavy indexes.

    What does it mean when futures are green?

    Green futures generally mean the futures contract is trading above the relevant previous reference level. This can indicate stronger overnight pricing, but it does not guarantee that the stock market will remain higher after the open.

    Do futures predict the stock market?

    No. Futures can provide useful information about overnight pricing and potential opening conditions, but they do not reliably predict the entire trading session.

    Why do futures sometimes reverse at the open?

    The regular stock market introduces new orders, liquidity and information when trading begins. That can cause prices to move differently from the overnight futures signal.

    What is an implied open?

    An implied open is an estimate of where an underlying stock-market index may begin regular trading based on futures pricing and its relationship with the cash market.


    Final Takeaway

    Learning how to read stock market futures before the open is less about memorizing whether green means “up” and red means “down.”

    The useful information comes from putting several pieces together.

    Start with ES for the broad market. Compare it with NQ and YM to see whether the move is widespread or concentrated. Look at the percentage change, investigate the overnight catalyst, consider volume and liquidity, and understand the difference between futures prices, fair value and the potential implied open.

    Most importantly, treat futures as pre-market context rather than a guaranteed prediction.

    That approach gives you a clearer framework for understanding what the market is pricing before the opening bell without assuming that the overnight move will determine the entire trading day.
  • How to Read Stock Charts: A Beginner’s Step-by-Step Guide

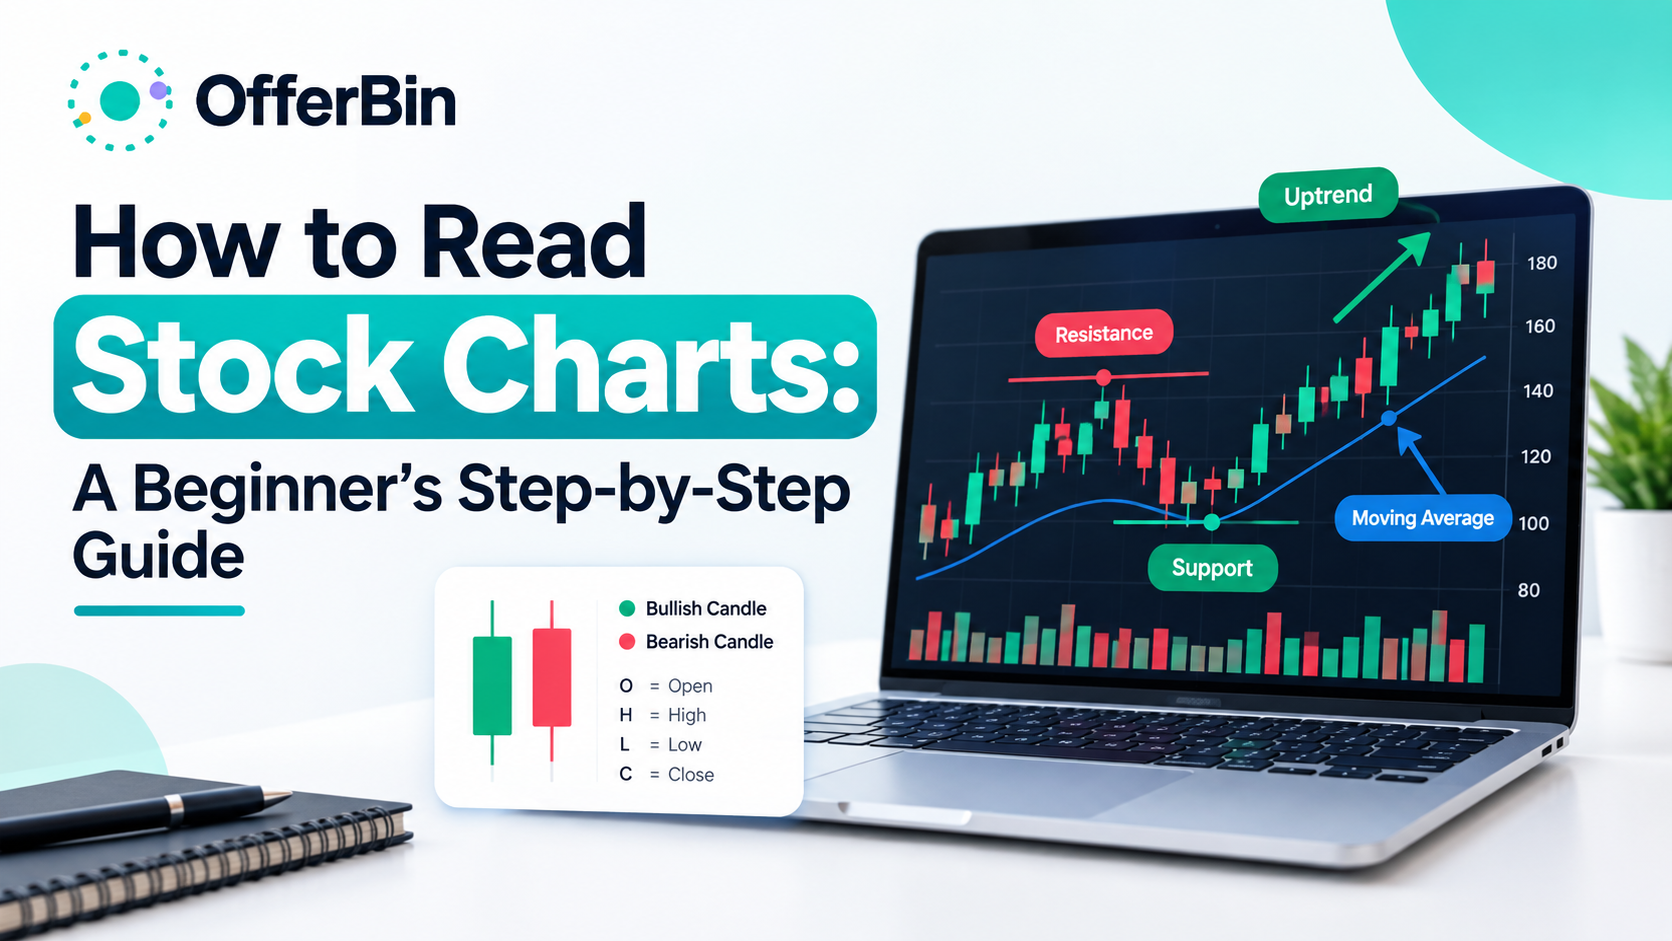
    How to Read Stock Charts: A Beginner’s Step-by-Step Guide

    A stock chart shows how a stock’s price has moved over a period of time. To read one, start with the timeframe and overall trend, then examine price levels, candlesticks, trading volume, and selected indicators. The goal is to understand what the chart is showing—not to assume it can predict exactly what happens next.

    If you’re new to stock charts, the amount of information on a typical chart can look overwhelming. Lines, candles, numbers, volume bars, indicators, and patterns can all appear at once.

    The good news is that you don’t need to understand everything immediately.

    A practical way to read a stock chart is to work through it in a consistent order:

    Timeframe → Trend → Key levels → Volume → Candlesticks → Indicators → Patterns → Context

    This guide explains each step in plain language and shows how the different pieces fit together.

    What Is a Stock Chart?

    A stock chart is a visual representation of a stock’s price movement over time. Depending on the chart type, it can also show information such as the opening price, highest price, lowest price, closing price, and trading volume.

    Most stock charts have two basic axes:

    • Horizontal axis: represents time.
    • Vertical axis: represents price.

    For example, a daily chart may show one trading day at a time, while an intraday chart could show price movement minute by minute.

    A chart helps you see historical price behavior quickly. It can show whether price has generally moved upward, downward, or sideways and where important price levels have developed.

    However, a chart does not contain every factor that can affect a stock. Company earnings, economic conditions, interest rates, news, management decisions, valuation, and other fundamental factors may also influence prices.

    How to Read a Stock Chart Step by Step

    You can make stock chart analysis much easier by following the same sequence every time.

    Start With the Timeframe

    Before interpreting a chart, check its timeframe.

    A chart can look completely different depending on whether you’re viewing:

    • One-minute candles
    • Five-minute candles
    • One-hour candles
    • Daily candles
    • Weekly candles
    • Monthly candles

    A short timeframe shows smaller price movements, while a longer timeframe can make broader trends easier to see.

    For beginners, starting with a daily or weekly chart can make it easier to understand the bigger picture before looking at shorter-term movements.

    Check the Overall Trend

    Next, ask a simple question:

    Is the stock moving generally upward, downward, or sideways?

    An uptrend commonly features a sequence of higher highs and higher lows.

    A downtrend commonly features lower highs and lower lows.

    A sideways market moves within a relatively defined range without a clear sustained upward or downward direction.

    Don’t determine the trend from one candle. Look at a meaningful section of the chart and consider how the sequence of highs and lows is developing.

    Identify Support and Resistance

    After identifying the trend, look for important price areas.

    Support is an area where buying interest has previously helped slow or stop a decline.

    Resistance is an area where selling pressure has previously helped slow or stop an advance.

    These are better understood as zones rather than perfectly precise lines. Price can move slightly through a level before reversing, and previous support can sometimes become resistance after a breakdown.

    Look at Trading Volume

    Volume tells you how many shares changed hands during a particular period.

    Price and volume can provide useful context when viewed together.

    For example:

    • Rising price with increasing volume can indicate stronger participation.
    • A price move on unusually low volume may deserve additional scrutiny.
    • High volume during a breakout can provide additional context.
    • A sudden volume spike can accompany important news or significant price movement.

    Volume does not automatically confirm that a move will continue. It is one piece of information among several.

    Read the Latest Candlesticks

    Once you understand the broader trend, examine the latest candles.

    Look at:

    • Candle direction
    • Candle body size
    • Upper wick
    • Lower wick
    • Position relative to recent price levels
    • Volume during the move

    A single candle rarely provides enough information by itself. Its meaning depends heavily on where it appears on the chart and what price was doing beforehand.

    Check a Small Number of Indicators

    Indicators can help organize price information, but more indicators do not necessarily produce better analysis.

    Common examples include:

    • Moving averages
    • Relative Strength Index (RSI)
    • Moving Average Convergence Divergence (MACD)

    For beginners, it can be more useful to understand one or two indicators properly than to place a large collection of indicators on the same chart.

    Look for Chart Patterns

    Finally, you can consider whether a recognizable chart pattern is developing.

    Examples include:

    • Double tops
    • Double bottoms
    • Head and shoulders
    • Triangles
    • Flags

    Patterns should be treated as potential interpretations rather than guaranteed forecasts. Context, volume, timeframe, and the broader market can all affect how a pattern develops.

    Stock Chart Types Explained

    Different chart types present price information in different ways.

    Chart typeWhat it showsBest use
    Line chartUsually closing prices connected over timeSeeing the broad trend
    Bar chartOpen, high, low and closeDetailed price analysis
    Candlestick chartOpen, high, low and close in an easy-to-read visual formatPrice action and chart analysis

    Line Charts

    Line charts are among the simplest stock charts.

    A line connects a series of prices—often closing prices—to show how the stock moved over time.

    They’re useful when you want to quickly see the overall direction without being distracted by individual intraday movements.

    Bar Charts

    A traditional price bar contains information about the stock’s:

    • Open
    • High
    • Low
    • Close

    This is commonly abbreviated as OHLC.

    The bar’s high and low show the trading range for that period, while small horizontal marks indicate the opening and closing prices.

    Candlestick Charts

    Candlestick charts contain the same basic OHLC information but present it in a more visual format.

    Each candle can quickly show:

    • Where price opened
    • Where price closed
    • The highest price reached
    • The lowest price reached

    This makes candlestick charts particularly popular for technical analysis.

    How to Read Candlestick Charts

    A candlestick has two main visual components:

    Body: shows the relationship between the opening and closing prices.

    Wicks or shadows: show prices reached above and below the candle’s body.

    The exact colors depend on the charting platform, but many platforms use green for a period where the closing price was higher than the opening price and red for a period where the closing price was lower.

    What Do Green and Red Candles Mean?

    A green candle generally means the closing price was above the opening price for that period.

    A red candle generally means the closing price was below the opening price.

    The color alone does not tell you what happens next.

    For example, a large green candle near resistance can mean something very different from a large green candle breaking above a long-established trading range.

    What Do the Wicks Mean?

    The upper wick shows how high price moved during the period before closing.

    The lower wick shows how low price moved.

    Long wicks can show that price moved significantly away from the eventual closing area during that period.

    Again, context matters. A long lower wick near a support zone has a different context from a long lower wick during a strong downtrend.

    How to Identify Trends on Stock Charts

    Trend analysis is one of the most useful starting points when reading a stock chart.

    Uptrend

    An uptrend generally develops through a series of:

    Higher highs + higher lows

    The stock is repeatedly reaching higher price levels while pullbacks are holding above previous lows.

    Downtrend

    A downtrend generally develops through:

    Lower highs + lower lows

    Rallies fail to reach previous highs, while declines continue to establish lower lows.

    Sideways Trend

    A stock may also trade sideways.

    In this situation, price repeatedly moves between a relatively defined upper and lower area without establishing a sustained directional trend.

    Sideways markets are sometimes described as ranges or consolidations.

    Why Higher Highs and Higher Lows Matter

    Looking at highs and lows can be more useful than simply asking whether a stock is “going up.”

    A stock may rise sharply for several days but still be part of a broader downtrend if its longer-term structure continues to produce lower highs and lower lows.

    This is why timeframe matters.

    Support and Resistance Explained

    Support and resistance are common concepts in stock chart analysis.

    What Is Support?

    Support is a price area where previous selling pressure has been met by enough buying activity to slow or reverse a decline.

    Support isn’t guaranteed to hold.

    If selling pressure becomes strong enough, price can move below the area.

    What Is Resistance?

    Resistance is a price area where previous upward movement has encountered selling pressure.

    A stock can break above resistance, remain below it, or briefly move above it and then fall back.

    How to Identify Support and Resistance on a Chart

    Look for areas where price has repeatedly:

    • Reversed upward
    • Reversed downward
    • Paused before continuing
    • Consolidated
    • Reacted strongly

    The more frequently price reacts around an area, the more noticeable that zone may become.

    But there is no universal rule that makes a particular support or resistance level certain to hold.

    Support and Resistance Zones

    It’s often better to think in terms of zones rather than exact numbers.

    For example, if a stock repeatedly reacts between $48 and $50, treating $49.00 as an exact dividing line may create a false sense of precision.

    A broader zone can better represent the historical price behavior.

    How to Read Stock Volume

    Volume measures the number of shares traded during a particular period.

    It is usually displayed below the main price chart as vertical bars.

    Volume can help provide context for price movements.

    Rising Price and Volume

    If price rises while volume also increases, the move is occurring alongside greater trading activity.

    That may provide useful confirmation, but it does not guarantee that the trend will continue.

    Falling Price and Volume

    A decline accompanied by elevated volume can indicate significant participation during the move.

    Again, the information should be interpreted alongside the broader trend and price structure.

    Volume During Breakouts

    Volume is often watched when price moves beyond an established resistance or support area.

    A breakout accompanied by noticeably higher volume may attract more attention than a move through the same level on unusually low volume.

    However, breakouts can fail.

    A move above resistance that quickly falls back into the previous range is sometimes described as a false breakout.

    Moving Averages and Other Stock Chart Indicators

    Indicators transform or organize price and volume data to help traders examine particular aspects of market behavior.

    They should not be treated as automatic buy or sell signals.

    Simple Moving Average

    A Simple Moving Average (SMA) calculates the average price over a specified number of periods.

    For example, a 50-day SMA uses the prices from the relevant 50 trading days to calculate an average that changes as new data arrives.

    Moving averages can help smooth short-term price fluctuations and make broader trends easier to observe.

    Exponential Moving Average

    An Exponential Moving Average (EMA) gives greater weight to more recent prices than a simple moving average.

    As a result, it can respond more quickly to recent price changes.

    Relative Strength Index

    The Relative Strength Index (RSI) is a momentum indicator commonly displayed on a scale from 0 to 100.

    It is often used to assess the strength of recent price movements and identify potentially overextended conditions.

    An RSI reading should not be interpreted in isolation or treated as proof that a stock must reverse.

    MACD

    The Moving Average Convergence Divergence (MACD) is another momentum and trend-related indicator.

    It compares moving averages and can help users examine changes in momentum and trend behavior.

    As with other indicators, the MACD is most useful when understood in the context of the underlying price action.

    Avoid Indicator Overload

    A common beginner mistake is adding many indicators because the chart looks more sophisticated.

    More information can actually make a chart harder to interpret.

    Start with the basic price structure. Add an indicator only when you understand what question it is helping you answer.

    Common Stock Chart Patterns

    Chart patterns describe recurring formations in price data.

    They can be useful for organizing what you see, but patterns are not guarantees of future price direction.

    Double Top

    A double top occurs when price reaches a similar high on two occasions and struggles to move beyond the area.

    The pattern is generally interpreted in the context of what happens after the second attempt.

    Double Bottom

    A double bottom is broadly the opposite structure, where price tests a similar low twice before moving away from the area.

    Head and Shoulders

    A head-and-shoulders structure typically contains:

    • A first peak
    • A higher central peak
    • A third peak that is lower than the central peak

    The lows between these peaks are often connected conceptually by a neckline.

    Triangles

    Triangle patterns form when price moves within converging boundaries.

    Common descriptions include:

    • Ascending triangle
    • Descending triangle
    • Symmetrical triangle

    The eventual direction is not guaranteed simply because a triangle appears.

    Flags

    Flag patterns are generally short-term consolidation structures that occur after a noticeable price movement.

    As with all chart patterns, context is important.

    A Simple Stock Chart Analysis Example

    Imagine you’re looking at a hypothetical daily stock chart.

    The first thing you notice is that price has been producing higher highs and higher lows over several weeks.

    That suggests an upward trend.

    Next, you identify a price zone where previous pullbacks stopped. That becomes an area of potential support.

    You also identify a higher price area where previous advances struggled. That’s a potential resistance zone.

    Then you examine volume.

    The latest upward move occurred with higher-than-usual volume, giving you additional information about participation during the move.

    You then inspect the most recent candles. Instead of focusing on one candle, you compare the latest candles with the surrounding price action.

    Finally, you look at a moving average to see whether it provides useful additional context.

    The result is not a prediction.

    Instead, you’ve built a structured description of the chart:

    • Timeframe: Daily
    • Trend: Upward
    • Structure: Higher highs and higher lows
    • Support: Identified below recent price
    • Resistance: Identified above recent price
    • Volume: Elevated during the recent move
    • Candles: Reviewed in context
    • Indicator: Used as supporting information

    This is a much more useful way to approach stock chart analysis than trying to find one “magic” signal.

    Common Mistakes Beginners Make

    Looking at Only One Candle

    One candle rarely explains the entire market structure.

    Always consider surrounding price action.

    Ignoring the Timeframe

    A stock can look bullish on a five-minute chart while looking bearish on a weekly chart.

    Always know which timeframe you’re analyzing.

    Using Too Many Indicators

    A chart covered in indicators can create confusion rather than clarity.

    Start with price and volume before adding additional tools.

    Treating Patterns as Guarantees

    A chart pattern is an interpretation of historical price behavior.

    It is not a guarantee of future performance.

    Ignoring Volume

    Price can tell you where the market moved. Volume can provide additional context about trading activity during that move.

    Assuming Support or Resistance Must Hold

    Support and resistance are areas of historical price reaction, not permanent barriers.

    Confusing Technical Analysis With Fundamental Analysis

    A chart primarily shows market data such as price and volume.

    It does not automatically tell you:

    • Whether a company is profitable
    • Whether its valuation is attractive
    • Whether revenue is growing
    • Whether management is effective
    • Whether a product will succeed

    Those questions require other forms of research.

    Stock Chart Reading Checklist

    Before drawing conclusions from a stock chart, ask:

    • What timeframe am I viewing?
    • What does the broader trend look like?
    • Are highs and lows rising or falling?
    • Where are the major support zones?
    • Where are the major resistance zones?
    • What is trading volume doing?
    • What do the latest candlesticks show?
    • Is there a recognizable chart pattern?
    • Are indicators actually adding useful information?
    • Is the broader market affecting the stock?
    • Am I interpreting a possibility as if it were a certainty?
    • What important information isn’t visible on the chart?

    This checklist can help prevent you from focusing too heavily on one signal.

    Can Stock Charts Predict Future Prices?

    No chart can guarantee what a stock will do next.

    Stock charts are primarily tools for examining historical price and volume behavior. Technical analysis can help users identify trends, levels, patterns and changes in momentum, but those observations do not remove uncertainty.

    Future prices can be affected by information that isn’t visible on a chart, including company results, economic data, interest rates, news, regulations and unexpected events.

    For that reason, chart analysis is better understood as a method of interpreting market data than as a reliable prediction machine.

    Technical Analysis vs. Fundamental Analysis

    Technical and fundamental analysis approach markets from different angles.

    Technical analysisFundamental analysis
    Focuses heavily on price and volumeFocuses on business and economic factors
    Uses charts and indicatorsUses financial statements, valuation and business information
    Examines historical market behaviorExamines underlying financial and economic conditions
    Often emphasizes trends and patternsOften emphasizes earnings, cash flow and valuation

    These approaches don’t necessarily have to be treated as mutually exclusive. They answer different questions.

    How to Get Better at Reading Stock Charts

    The best way to improve is to practice interpreting charts systematically.

    Start with the basics:

    1. Choose a timeframe.
    2. Identify the overall trend.
    3. Mark obvious support and resistance zones.
    4. Examine volume.
    5. Read the latest candlesticks.
    6. Add only the indicators you understand.
    7. Look for patterns.
    8. Write down what the chart actually shows.
    9. Separate observations from assumptions.
    10. Review what happened afterward without changing your original interpretation.

    That last step is especially useful for learning. It helps you evaluate whether your interpretation was supported by the information available at the time rather than judging it only from hindsight.

    FAQs About Reading Stock Charts

    How do you read stock charts for beginners?

    Start by identifying the timeframe and overall trend. Then examine higher highs and lower lows, support and resistance, trading volume, candlesticks and a small number of useful indicators. Focus on the complete price structure rather than trying to interpret one candle or indicator in isolation.

    What do the lines on a stock chart mean?

    Lines can represent different types of information. The main price line may connect closing prices, while other lines may represent moving averages, trendlines, support or resistance. Always check the chart legend or indicator label to determine exactly what a particular line represents.

    What do green and red candles mean?

    On many charting platforms, a green candle means the closing price was higher than the opening price, while a red candle means the closing price was lower than the opening price. Color conventions can vary, so check your charting platform’s settings.

    What are OHLC prices?

    OHLC stands for Open, High, Low and Close. These four values describe the opening price, highest price, lowest price and closing price for a specific trading period.

    How do you identify an uptrend?

    An uptrend generally features a sequence of higher highs and higher lows. Rather than relying on one upward move, look at the broader structure of the chart and consider the timeframe you’re analyzing.

    How do you identify support and resistance?

    Look for price areas where the stock has repeatedly paused, reversed or struggled to move through. Support generally refers to areas where declines have previously slowed, while resistance refers to areas where advances have previously encountered selling pressure.

    What does volume tell you on a stock chart?

    Volume shows how many shares were traded during a particular period. It can provide context for price movements, including whether a breakout or decline occurred alongside unusually high trading activity.

    What is the best timeframe for reading stock charts?

    There is no single best timeframe for everyone. The appropriate timeframe depends on the question being analyzed. Longer timeframes can help reveal broader trends, while shorter timeframes show more detailed price movements.

    Which indicators should beginners use?

    Beginners can start by understanding basic tools such as moving averages, RSI and MACD. The important point is not to use as many indicators as possible, but to understand what each indicator measures and how it complements the price chart.

    Can stock charts predict stock prices?

    No. Charts can help analyze historical price and volume behavior, but they cannot guarantee future price movements. Market prices can change because of company-specific, economic, political, regulatory and other unexpected factors.

    Final Takeaway

    Learning how to read stock charts becomes easier when you stop trying to interpret everything at once.

    Start with the timeframe, then examine the trend, support and resistance, volume, and candlesticks. After that, use indicators and chart patterns as supporting information rather than treating them as guaranteed signals.

    The most useful question isn’t simply, “What pattern is this?”

    It’s:

    “What is the chart actually showing, what evidence supports that interpretation, and what remains uncertain?”

    That approach can help you read stock charts more systematically while avoiding many of the common mistakes beginners make.

  • Micro vs E-mini Futures: Contract Size, Tick Value & Risk Explained

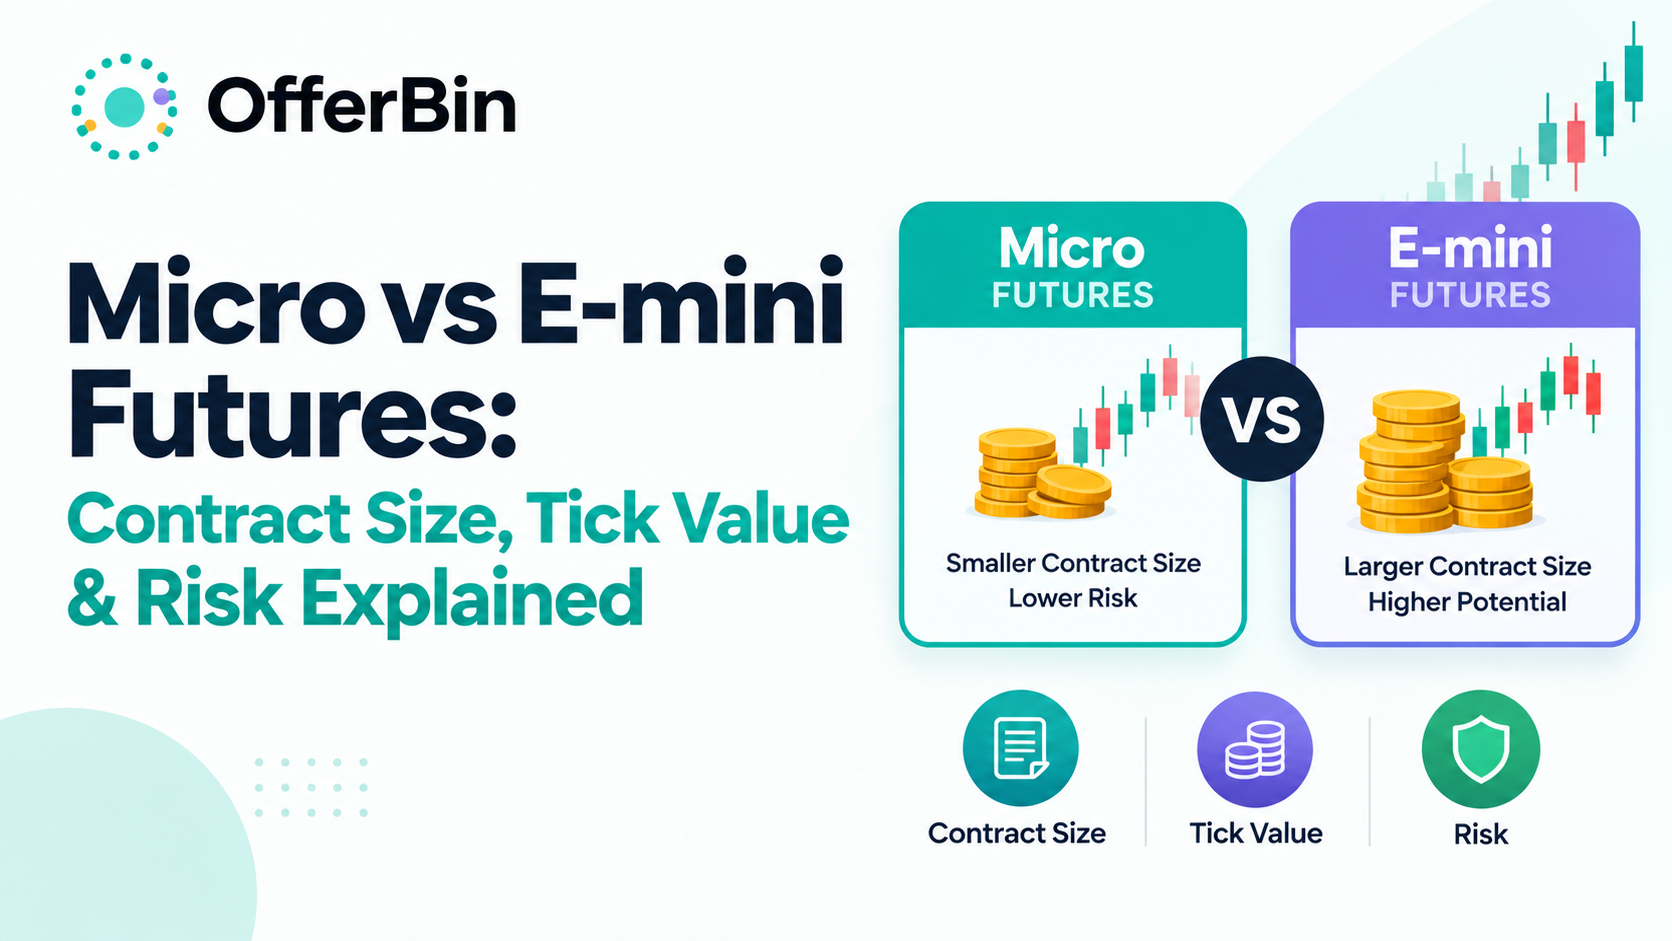
    Micro vs E-mini Futures: Contract Size, Tick Value & Risk Explained

    If you’re comparing Micro vs E-mini futures, the biggest difference is contract size. Micro E-mini futures generally represent one-tenth the contract size of their corresponding E-mini contracts. That means the underlying market can be the same, while the dollar value of each point and tick is much smaller.

    For example, one E-mini S&P 500 (ES) contract uses a $50 multiplier, while one Micro E-mini S&P 500 (MES) contract uses a $5 multiplier. At an S&P 500 index level of 5,000, that represents approximately $250,000 of notional exposure for ES versus $25,000 for MES.

    That 10-to-1 relationship is the foundation for understanding Micro vs E-mini futures. But contract size is only part of the comparison. Tick value, margin, leverage, trading costs, liquidity, and position sizing also matter.

    Micro vs E-mini Futures: What’s the Difference?

    Micro E-mini futures are smaller-sized versions of major E-mini equity index futures. CME Group currently lists Micro E-mini contracts for major U.S. equity benchmarks including the S&P 500, Nasdaq-100, Dow Jones Industrial Average, and Russell 2000.

    The basic relationship looks like this:

    FeatureMicro E-mini FuturesE-mini Futures
    Contract sizeSmallerLarger
    Typical relationship1/10 of E-mini10× Micro
    Dollar exposure per pointLowerHigher
    Tick valueLowerHigher
    Position sizing flexibilityMore granularLess granular
    Margin requirementGenerally lower, but variesGenerally higher
    Market exposureSame underlying benchmarkSame underlying benchmark
    Main symbolsMES, MNQ, MYM, M2KES, NQ, YM, RTY

    CME describes Micro E-mini contracts as one-tenth the size of their E-mini counterparts. The smaller multiplier reduces the dollar value of each index movement while preserving exposure to the same benchmark.

    The 10:1 Contract-Size Relationship

    The simplest way to remember the difference is:

    10 Micro contracts ≈ 1 corresponding E-mini contract in notional exposure.

    For example:

    • 10 MES ≈ 1 ES
    • 10 MNQ ≈ 1 NQ
    • 10 MYM ≈ 1 YM
    • 10 M2K ≈ 1 RTY

    This relationship is about contract size and exposure. It does not mean that trading ten Micro contracts will have exactly the same total transaction costs or execution characteristics as trading one E-mini contract.

    What Stays the Same Between Micro and E-mini Futures?

    The Micro and E-mini versions generally track the same underlying equity indexes.

    That means the comparison is not primarily about choosing a different index. It is about choosing a different contract size for that index exposure.

    For example:

    • MES and ES track the S&P 500.
    • MNQ and NQ track the Nasdaq-100.
    • MYM and YM track the Dow Jones Industrial Average.
    • M2K and RTY track the Russell 2000.

    This makes Micro futures useful when a trader wants smaller increments of exposure rather than changing the underlying market.

    What Changes?

    The most important differences are:

    • Contract multiplier
    • Dollar value per index point
    • Dollar value per tick
    • Notional exposure
    • Margin requirements
    • Position-size flexibility
    • Trading-cost impact

    Understanding these differences is more useful than simply memorizing the names “Micro” and “E-mini.”

    Micro vs E-mini Futures Contract Sizes

    The contract multiplier determines how much a one-point movement in the underlying index is worth.

    CME’s current materials show the following relationships for the major U.S. equity-index contracts.

    IndexMicro SymbolMicro $/PointE-mini SymbolE-mini $/Point
    S&P 500MES$5ES$50
    Nasdaq-100MNQ$2NQ$20
    Dow Jones Industrial AverageMYM$0.50YM$5
    Russell 2000M2K$5RTY$50

    The exact notional value changes with the index level because futures exposure is calculated from the index price multiplied by the contract multiplier.

    S&P 500: MES vs ES

    The Micro E-mini S&P 500 contract is MES, while the larger E-mini S&P 500 contract is ES.

    CME specifies:

    • MES multiplier: $5 × S&P 500 Index
    • ES multiplier: $50 × S&P 500 Index

    At an index level of 5,000:

    MES:
    5,000 × $5 = $25,000

    ES:
    5,000 × $50 = $250,000

    So one ES contract represents ten times the notional exposure of one MES contract.

    Nasdaq-100: MNQ vs NQ

    For the Nasdaq-100:

    • MNQ uses a $2 multiplier.
    • NQ uses a $20 multiplier.

    Therefore, one NQ contract represents approximately ten times the notional exposure of one MNQ contract at the same index level.

    Because the Nasdaq-100 can make relatively large index moves, understanding this multiplier is particularly important when calculating potential profit and loss.

    Dow Jones: MYM vs YM

    The Micro E-mini Dow contract is MYM, while the E-mini Dow contract is YM.

    The multipliers are:

    • MYM: $0.50 per index point
    • YM: $5 per index point

    Again, the E-mini contract is ten times the size of the Micro version.

    Russell 2000: M2K vs RTY

    For the Russell 2000:

    • M2K: $5 per index point
    • RTY: $50 per index point

    CME identifies M2K as the smaller-sized version of the Russell 2000 E-mini contract and lists a minimum tick of 0.10 index points.

    Tick Size vs Tick Value: What’s the Difference?

    These two terms are easy to confuse.

    Tick Size

    👉Tick size is the smallest price increment by which a futures contract can move.

    Tick Value

    Tick value is the amount of money represented by that minimum price movement.

    The basic calculation is:

    Tick value = Tick size × Contract multiplier

    For MES, for example:

    0.25 index points × $5 = $1.25 per tick

    A one-point move contains four 0.25-point ticks, so:

    4 × $1.25 = $5 per point

    CME’s educational material confirms that a one-tick move in Micro E-mini S&P 500 futures is $1.25 and a one-point move is $5.

    Why Tick Value Matters

    Suppose MES moves 20 points.

    The calculation is:

    20 × $5 = $100

    For ES:

    20 × $50 = $1,000

    The underlying index moved the same number of points. The difference comes from the contract multiplier.

    That is why understanding the multiplier is essential before thinking about profit, loss or risk.

    How Much Does a Price Move Affect Your P&L?

    A simple formula helps:

    P&L = Number of Contracts × Point Movement × Dollar Value Per Point

    Consider a hypothetical 10-point move in the S&P 500.

    One MES Contract

    10 points × $5 = $50

    One ES Contract

    10 points × $50 = $500

    The calculation is hypothetical and excludes commissions, exchange fees, slippage and other trading costs.

    This also works in the opposite direction. A 10-point adverse move would represent the same dollar magnitude of loss before costs.

    That’s an important point: Micro futures are smaller, but they are not risk-free.

    Micro vs E-mini Futures Margin Requirements

    Margin is one of the most misunderstood parts of futures trading.

    Futures margin is not the same thing as paying the full notional value of a contract. Instead, a trader generally posts a performance bond or margin amount to establish a futures position.

    CME explains that the margin requirement is only a fraction of the contract’s total notional value.

    However, margin figures can change.

    They may differ according to:

    • Market conditions
    • Exchange requirements
    • Broker policies
    • Account type
    • Position type
    • Intraday versus overnight requirements

    CME’s published Micro E-mini margin information explicitly notes that margin estimates are subject to change.

    For that reason, a fixed dollar margin figure should not be treated as a permanent rule.

    Initial Margin vs Maintenance Margin

    Initial margin is generally the amount required to establish a futures position.

    Maintenance margin is the minimum account equity requirement that must generally be maintained while the position remains open.

    Exact requirements should always be checked with the relevant futures broker and exchange because they can change.

    Why Margin Shouldn’t Be Confused With Risk

    A common mistake is thinking:

    “If the broker lets me open the position with $X of margin, then $X is the amount I can safely risk.”

    That’s incorrect.

    Margin determines how much capital is required to carry a position under the applicable rules. Your actual market exposure can be much larger.

    CME illustrates this distinction by showing how a Micro E-mini S&P 500 contract can provide substantial notional exposure relative to the margin required.

    Micro vs E-mini Futures: Risk and Leverage

    Micro futures reduce the dollar amount attached to each index movement, but they do not remove leverage.

    That distinction matters.

    Suppose an index moves against a position by 50 points.

    For one MES:

    50 × $5 = $250

    For one ES:

    50 × $50 = $2,500

    The Micro contract creates a smaller dollar impact for the same index movement.

    This can also allow more granular position sizing. Instead of moving directly from one large contract to no position, a trader can potentially adjust exposure using smaller contracts.

    That flexibility does not eliminate the possibility of significant losses.

    Position Size Matters More Than the Contract Name

    The important question isn’t simply:

    “Are Micro futures safer?”

    A better question is:

    “How much dollar exposure does the position create relative to the account and risk plan?”

    Ten MES contracts have approximately the same contract-size exposure as one ES contract. Therefore, simply choosing Micro futures does not automatically create lower overall exposure if the number of contracts is increased.

    Liquidity and Trading Costs

    Micro and E-mini futures can differ in liquidity and trading costs, but those differences should be considered product by product rather than assumed universally.

    Liquidity can affect:

    • Bid-ask spreads
    • Order execution
    • Slippage
    • Ability to enter or exit larger positions
    • Transaction costs

    The E-mini contracts have historically been major equity-index futures products, while Micro contracts provide smaller versions of those exposures.

    A smaller contract does not automatically mean lower total trading cost.

    For example, if ten Micro contracts are required to replicate approximately one E-mini contract’s exposure, the commission structure may make the total cost different from trading one E-mini contract.

    Always check the current fee schedule for the broker and contract being considered.

    Micro vs E-mini Futures for Position Sizing

    One of the main practical differences is granularity.

    Suppose a hypothetical strategy calls for exposure equivalent to 0.3 of an ES contract.

    A trader cannot simply buy 0.3 of one standard ES futures contract.

    But the smaller Micro contract allows exposure to be built in smaller increments.

    For example:

    • 1 MES = 0.1 ES
    • 2 MES = 0.2 ES
    • 3 MES = 0.3 ES
    • 5 MES = 0.5 ES
    • 10 MES = approximately 1 ES

    This does not mean that every position should be constructed this way. It simply demonstrates why smaller contracts can provide more flexibility in position sizing.

    Are Micro Futures Less Risky Than E-mini Futures?

    One Micro contract has less dollar exposure than one corresponding E-mini contract.

    But that does not mean Micro futures are inherently low-risk.

    Risk depends on factors such as:

    • Number of contracts
    • Price movement
    • Position size
    • Account capital
    • Stop or exit methodology
    • Volatility
    • Trading costs
    • Leverage

    For example, ten MES contracts have approximately the same contract-size exposure as one ES contract.

    So the correct distinction is:

    Smaller contract ≠ automatically safer position.

    Instead:

    Smaller contract = smaller dollar exposure per contract.

    That difference is fundamental.

    Micro vs E-mini Futures: Liquidity, Fees and Execution

    When comparing the two contract sizes, look beyond the multiplier.

    Liquidity

    Liquidity describes how easily orders can be executed without significantly affecting the market price.

    The E-mini contracts have long been important benchmark futures products. Micro contracts provide smaller-sized access to the same underlying indexes.

    Actual liquidity can vary by product, contract month and market conditions.

    Commissions

    Commission structures vary by broker.

    Trading ten Micro contracts instead of one E-mini may produce a different total commission bill depending on the broker’s pricing model.

    This is why “Micro futures are cheaper” is too broad a statement.

    The contract itself has a smaller dollar value, but total trading cost depends on how many contracts you trade and what your broker charges.

    Slippage

    Slippage occurs when an order is executed at a different price from the one expected.

    It can be affected by:

    • Market volatility
    • Liquidity
    • Order type
    • Market conditions
    • Position size

    These factors should be considered separately from contract size.

    Futures Expiration and Settlement

    Micro and E-mini equity-index futures are not perpetual contracts.

    They have expiration cycles and settlement procedures.

    CME states that Micro E-mini equity-index futures follow the same general quarterly cycle as their corresponding E-mini products, with cash settlement procedures tied to the underlying indexes.

    Before expiration, a futures position can generally be:

    • Offset
    • Rolled into another contract month
    • Held through settlement where applicable

    CME specifically notes that traders should understand their approach to expiration and rollover before the contract reaches its final trading period.

    This is another reason to check the current contract specifications rather than relying on an old article.

    Micro vs E-mini Futures: Which One Fits a Given Situation?

    There isn’t one universally correct contract size for every trader.

    Instead, the comparison can be approached through the characteristics of each contract.

    Smaller exposure

    Micro contracts provide smaller dollar exposure per contract.

    More granular sizing

    Micro contracts allow exposure to be adjusted in smaller increments.

    Larger exposure per contract

    E-mini contracts produce a larger dollar change for every index-point movement.

    Scaling

    Micro contracts can provide more flexibility when building or reducing exposure in smaller increments.

    Transaction costs

    The number of contracts and broker fee structure should be considered before assuming one size is cheaper.

    The key is to compare exposure, position size, costs and risk together, rather than focusing on margin alone.

    Common Mistakes When Comparing Micro and E-mini Futures

    Mistake 1: Confusing Margin With Contract Value

    Margin is not the same as notional exposure.

    A relatively small margin requirement can control a much larger futures position.

    Mistake 2: Ignoring the Contract Multiplier

    Two contracts can track the same index but have very different dollar values per point.

    Always check the multiplier.

    Mistake 3: Assuming Ten Micros Cost the Same as One E-mini

    Ten Micro contracts approximate one E-mini in contract-size exposure, but fees and execution costs can differ.

    Mistake 4: Assuming Micro Means Low Risk

    A smaller contract reduces the dollar value per contract. It does not remove leverage or market risk.

    Mistake 5: Using Outdated Margin Figures

    Margin requirements change.

    CME’s own historical margin tables explicitly state that published estimates are subject to change.

    Mistake 6: Forgetting Expiration

    Futures have contract months and settlement procedures. A futures position should not be treated like a perpetual spot position.

    Micro vs E-mini Futures FAQs

    How many Micro futures equal one E-mini?

    For the major Micro E-mini equity-index contracts, 10 Micro contracts correspond approximately to one E-mini contract in contract size. For example, 10 MES contracts have approximately the same notional contract-size exposure as one ES contract.

    What is the difference between MES and ES?

    MES is the Micro E-mini S&P 500 futures contract, while ES is the larger E-mini S&P 500 futures contract. MES uses a $5 multiplier, while ES uses a $50 multiplier.

    What is the difference between MNQ and NQ?

    MNQ is the Micro E-mini Nasdaq-100 futures contract and NQ is the larger E-mini Nasdaq-100 contract. MNQ uses a $2 multiplier while NQ uses a $20 multiplier.

    Are Micro futures the same market as E-mini futures?

    The corresponding Micro and E-mini contracts provide exposure to the same underlying equity-index benchmark, but they have different contract multipliers and therefore different dollar exposure per point.

    Are Micro futures cheaper to trade?

    Not necessarily. A single Micro contract has smaller exposure, but traders may need multiple Micro contracts to replicate one E-mini contract. Total commissions and other trading costs depend on the number of contracts and the broker’s pricing.

    Are Micro futures less risky?

    One Micro contract has lower dollar exposure than one corresponding E-mini contract. However, total risk depends on the number of contracts, price movement, leverage, account size and other factors.

    What is the tick value of MES?

    MES has a minimum tick of 0.25 index points and a $5 multiplier, producing a tick value of $1.25.

    What is the tick value of ES?

    ES also moves in 0.25-point increments, but its $50 multiplier means each minimum tick is worth $12.50.

    What are the Micro futures symbols?

    CME identifies the major Micro E-mini equity-index symbols as:

    • MES — S&P 500
    • MNQ — Nasdaq-100
    • MYM — Dow Jones Industrial Average
    • M2K — Russell 2000

    Can Micro futures be used for smaller position sizing?

    Yes. Their smaller contract multipliers allow exposure to be adjusted in smaller increments than with the corresponding E-mini contracts. That can provide greater flexibility when managing position size.

    Do Micro and E-mini futures expire?

    Yes. Equity-index futures have contract months and expiration/settlement procedures. CME provides current contract calendars and settlement information, so traders should verify the applicable contract specifications before expiration.

    Key Takeaways

    The main difference between Micro and E-mini futures is contract size.

    Micro E-mini contracts are generally one-tenth the size of their corresponding E-mini contracts. That means:

    • MES is 1/10 the contract size of ES.
    • MNQ is 1/10 the contract size of NQ.
    • MYM is 1/10 the contract size of YM.
    • M2K is 1/10 the contract size of RTY.

    The smaller contract size produces a smaller dollar value per index point and allows more granular position sizing.

    But Micro futures still involve leverage, market risk, fees and expiration. A smaller contract should therefore be understood as a smaller unit of exposure, not as a risk-free or automatically safer trading product.

    For more market-focused educational resources, you can explore the OfferBin blog, while OfferBin.io provides live market data and token conversion tools for supported crypto assets. OfferBin itself is a market-data reference and converter, not a futures broker or trading platform.

  • What Is a Value Trade? How Value Trading Works

    What Is a Value Trade? How Value Trading Works

    A value trade is based on a simple idea: a security may be worth more than its current market price.

    Instead of focusing only on where a stock’s price is moving, value-oriented investors examine the underlying business, its earnings, assets, cash flow, growth prospects, and other fundamentals. They then estimate what the security may be worth and compare that estimate with its market price.

    If the estimated value is meaningfully higher than the market price, the security may appear undervalued. But that does not automatically make it a good investment. Valuation is an estimate, and the market may have a good reason for pricing a company cheaply.

    The distinction matters because cheap is not always the same as undervalued.

    This guide explains what a value trade means, how value trading works, which valuation metrics investors commonly examine, how value trading differs from value investing, and how to recognize potential value traps.

    Key takeaway: Value trading uses fundamental analysis and valuation to look for securities whose market prices appear lower than their estimated underlying value. The central challenge is determining whether the valuation is correct and whether the market will eventually recognize that value.

    What Is a Value Trade?

    A value trade is a market position based on the belief that an asset’s current price does not fully reflect its underlying or intrinsic value.

    For stocks, that analysis normally starts with the company rather than the chart. An investor may examine:

    • Revenue and earnings
    • Free cash flow
    • Assets and liabilities
    • Debt levels
    • Profit margins
    • Competitive position
    • Growth prospects
    • Dividend payments
    • Industry conditions
    • Management
    • Valuation multiples

    The investor then compares those fundamentals with the company’s current market valuation.

    The underlying concept is closely related to value investing. FINRA describes value investing as using fundamental analysis to identify securities that appear to trade below their intrinsic worth or below comparable securities.

    However, the phrase “value trade” is less standardized than “value investing.” Depending on context, it can describe a specific value-oriented position, a trading thesis based on valuation, or a broader value-investing approach.

    That makes it important to define the strategy before applying it.

    How Does Value Trading Work?

    Value trading generally follows a process rather than relying on one financial ratio.

    Find Potentially Undervalued Stocks

    The first step is to identify companies whose valuation appears low relative to their fundamentals, historical valuation, or comparable companies.

    A low P/E ratio, for example, can attract attention. But a low multiple by itself does not prove that a stock is undervalued.

    The company could have declining earnings, excessive debt, weak competitive advantages, or an industry facing structural problems.

    Analyze the Company’s Fundamentals

    Fundamental analysis examines the economic and financial characteristics of a business.

    CFA Institute distinguishes fundamental analysis from technical analysis by noting that fundamental analysis uses information about the economy, industry, and company to estimate a security’s value and compare that estimate with its market price.

    A basic fundamental review might examine:

    • Revenue growth
    • Earnings quality
    • Free cash flow
    • Profitability
    • Debt
    • Return on equity
    • Capital requirements
    • Competitive advantages
    • Industry trends

    Estimate Intrinsic or Fair Value

    The next step is estimating what the business may be worth.

    There is no single universal formula for intrinsic value. Analysts can use different approaches, including:

    • Discounted cash flow models
    • Dividend discount models
    • Price multiples
    • Enterprise-value multiples
    • Asset-based valuation
    • Comparable-company analysis

    CFA Institute identifies present-value, multiplier, and asset-based approaches among the major categories of equity valuation models.

    Because different assumptions can produce different results, intrinsic value should be treated as an estimate rather than an objective number.

    Compare Market Price With Estimated Value

    Suppose a hypothetical company trades at $60 per share while an analyst’s valuation model estimates a value of $80.

    The difference does not mean the stock will automatically rise to $80.

    Instead, it creates a valuation question:

    Why is the market pricing the company at $60?

    The answer could reveal either an opportunity or a problem.

    Look for a Reason the Valuation Could Change

    A value thesis often needs some reason for the market’s perception to change.

    Potential catalysts might include:

    • Improving earnings
    • Debt reduction
    • Higher free cash flow
    • Successful restructuring
    • New products
    • Asset sales
    • Industry recovery
    • Improved profitability
    • Management changes

    A company can remain apparently undervalued for a long time, so identifying the investment thesis is an important part of the analysis.


    Value Trading vs. Value Investing

    The terms value trading and value investing overlap, but they are not necessarily identical.

    Value TradingValue Investing
    Can describe a valuation-based market positionUsually describes a broader investment philosophy
    May involve a defined thesis or catalystOften emphasizes longer-term ownership
    Can focus on price/value discrepanciesUsually focuses on business fundamentals and intrinsic value
    Time horizon can varyOften associated with a longer horizon
    May use valuation plus catalystsTypically emphasizes fundamental valuation
    Can be more tacticalGenerally more thesis-driven

    The boundary is not fixed. Someone using valuation to identify a mispriced stock could reasonably describe the approach as value trading, value investing, or both.

    The important point is the method used to establish value, not the label.


    How to Find Potentially Undervalued Stocks

    Finding an undervalued stock requires more than searching for companies with low prices.

    A stock trading at $10 can be more expensive relative to its fundamentals than a stock trading at $200.

    The analysis should focus on valuation relative to the company’s underlying financial characteristics.

    Price-to-Earnings Ratio

    The price-to-earnings (P/E) ratio compares a company’s share price with its earnings per share.

    A simplified formula is:

    P/E = Share Price ÷ Earnings Per Share

    Investors often compare P/E ratios with:

    • Industry peers
    • Historical company valuations
    • Expected earnings growth
    • Profitability
    • Business quality

    A low P/E can indicate a potentially attractive valuation, but it can also reflect weak growth expectations or deteriorating fundamentals.

    CFA Institute notes that price multiples are widely used valuation tools and that P/E relates market price to fundamental measures such as earnings.

    Price-to-Book Ratio

    The price-to-book (P/B) ratio compares a company’s market value with its book value.

    It can be particularly useful when analyzing businesses with substantial tangible assets, although its usefulness varies significantly between industries.

    A lower P/B does not automatically mean a company is undervalued. Investors should consider why the market assigns that valuation.

    Free Cash Flow

    Free cash flow can provide another perspective on the economic resources generated by a business.

    CFA Institute describes free-cash-flow valuation as a form of discounted cash flow analysis in which expected future cash flows are used to estimate intrinsic value.

    When examining free cash flow, investors may ask:

    • Is cash flow consistently positive?
    • Is it growing?
    • How much capital does the business need?
    • Is reported profit supported by cash generation?
    • How much debt does the company carry?

    Dividend Yield

    Dividend yield measures annual dividends relative to the stock price.

    A simplified formula is:

    Dividend Yield = Annual Dividend Per Share ÷ Share Price × 100

    A high dividend yield can attract value-oriented investors, but a high yield can also result from a falling stock price or an unsustainable dividend.

    The dividend therefore needs to be considered alongside earnings, free cash flow, payout ratios, and the company’s financial position.

    Earnings Growth

    Value analysis should not ignore growth.

    A company with a low valuation and steadily improving earnings may have a different risk profile from a company with a low valuation because its business is deteriorating.

    The quality and sustainability of earnings therefore matter as much as the headline valuation multiple.

    Balance Sheet Strength

    Debt can significantly change a value thesis.

    Two companies can have similar P/E ratios while carrying very different levels of debt.

    Useful questions include:

    • How much debt does the company have?
    • Can it comfortably service that debt?
    • Are interest costs rising?
    • Does the company have sufficient liquidity?
    • Is management reducing or increasing leverage?

    Common Valuation Metrics at a Glance

    MetricWhat It MeasuresWhy Investors Use ItImportant Limitation
    P/EPrice relative to earningsCompares valuation with earningsLess useful when earnings are negative or distorted
    P/BPrice relative to book valueUseful for certain asset-heavy businessesBook value may not capture intangible assets well
    P/FCFPrice relative to free cash flowFocuses on cash generationFree cash flow can fluctuate
    Dividend YieldDividend relative to share priceHelps assess income componentHigh yield can signal risk
    EV/EBITDAEnterprise value relative to EBITDAUseful for comparing operating businessesEBITDA is not the same as free cash flow
    P/SPrice relative to salesUseful when earnings are temporarily weakSales do not necessarily equal profitability

    No single metric should normally be treated as a complete valuation model.


    Market Price vs. Intrinsic Value

    Market price is the price at which a security currently trades.

    Intrinsic value is an estimate of what the security may be worth based on its underlying economic characteristics.

    FINRA describes intrinsic value as an estimate of what an investment is fundamentally worth, based on factors such as earnings, assets, cash flow, growth prospects, and interest rates. It also notes that intrinsic value is subjective because different analysts can evaluate those factors differently.

    This creates three broad valuation scenarios:

    SituationRelationship
    Potentially undervaluedEstimated value > market price
    Potentially fairly valuedEstimated value ≈ market price
    Potentially overvaluedEstimated value < market price

    These are analytical classifications, not guarantees about future prices.

    CFA Institute similarly explains that when estimated intrinsic value exceeds market price, an analyst may infer that a security is undervalued, while emphasizing the uncertainty involved in valuation.


    What Is a Margin of Safety?

    A margin of safety is the gap between an investor’s estimated value and the price paid.

    The idea is straightforward.

    If your estimated intrinsic value is $100 and the market price is $95, the difference is relatively small.

    If the same estimate is $100 and the market price is $60, there is a much larger gap.

    But the size of that gap does not automatically tell you how safe the investment is.

    If your valuation estimate is wrong, the apparent margin of safety may disappear.

    That is why valuation assumptions deserve as much attention as the final number.


    Why a Stock Can Look Cheap but Still Be Expensive

    One of the biggest mistakes in value trading is assuming that a low valuation multiple automatically means a bargain.

    Consider a hypothetical company:

    • Current price: $20
    • P/E: 7
    • Debt: High
    • Revenue: Declining
    • Earnings: Declining
    • Industry: Shrinking

    At first glance, a P/E of 7 may appear attractive.

    But if earnings continue falling, the “cheap” valuation could be justified.

    Now consider another hypothetical company:

    • Current price: $50
    • P/E: 18
    • Debt: Moderate
    • Revenue: Growing
    • Earnings: Growing
    • Free cash flow: Strong
    • Competitive position: Improving

    The second company has a higher P/E but could potentially offer a stronger fundamental case.

    Valuation is about the relationship between price, fundamentals, risk, and future expectations—not simply finding the lowest number.


    Value Stocks vs. Growth Stocks

    Value and growth are often presented as opposing investment styles, although real companies can have characteristics of both.

    Value-Oriented ApproachGrowth-Oriented Approach
    Focuses heavily on valuationFocuses heavily on future growth
    Often looks for lower valuation multiplesMay accept higher valuation multiples
    Can favor established businessesOften favors businesses with strong expansion potential
    Emphasizes current fundamentalsPlaces greater weight on future earnings potential
    May seek a discount to estimated valueMay accept premium valuations for expected growth

    Neither category guarantees better performance.

    Market conditions can favor different styles at different times, and a company can move from one category to another.


    What Is a Value Trap?

    A value trap occurs when a security appears cheap but remains cheap—or falls further—because the underlying business is weaker than the valuation suggests.

    For example, a stock could have:

    • A low P/E
    • A low P/B
    • A high dividend yield

    and still be a poor value if:

    • Earnings are structurally declining
    • Debt is becoming unmanageable
    • The industry is shrinking
    • Competitive advantages are disappearing
    • Cash flow is deteriorating
    • Management is destroying shareholder value

    SEC-filed fund disclosures specifically warn that a security judged to be undervalued may actually be appropriately priced and that the market may fail to recognize perceived intrinsic value for a long period.

    This is one reason value analysis requires more than screening for low ratios.


    A Simple Value Trade Example

    Imagine a fictional company called Northstar Manufacturing.

    Its shares trade at $40.

    After reviewing the business, an analyst estimates a possible intrinsic value of $60 based on earnings, cash flow, comparable companies, and future assumptions.

    At first, the numbers suggest a discount.

    But the analyst then investigates why the market price is $40.

    Scenario A: Temporary Problem

    Northstar recently experienced a temporary supply-chain disruption.

    The business remains profitable, debt is manageable, and cash flow is expected to recover.

    The lower share price may have a temporary explanation.

    Scenario B: Structural Problem

    Northstar’s main products are becoming obsolete.

    Revenue is declining, debt is rising, and management has no credible plan to reverse the trend.

    The $40 market price may not represent an overlooked bargain.

    It may reflect the market’s expectations about the company’s future.

    This illustrates an important principle:

    A value trade is not simply a difference between two numbers. The reason for that difference matters.


    A Practical Value Trading Checklist

    Before treating a stock as a potential value opportunity, investors can ask:

    Valuation

    • Is the company inexpensive relative to relevant peers?
    • Is the valuation attractive compared with its own history?
    • Which valuation method is most appropriate?

    Fundamentals

    • Are revenue and earnings stable or improving?
    • Is free cash flow healthy?
    • Is the balance sheet strong?
    • Is debt manageable?

    Business Quality

    • Does the company have a sustainable competitive advantage?
    • Is its industry healthy?
    • Is management allocating capital effectively?

    Risk

    • What could invalidate the valuation?
    • Could earnings fall further?
    • Could debt become a problem?
    • Is the business facing structural disruption?

    Thesis

    • Why does the market appear to be mispricing the company?
    • What could cause the valuation gap to narrow?
    • How long could that process take?

    Valuation Uncertainty

    • What assumptions are driving the estimated value?
    • What happens if those assumptions are wrong?
    • Would the thesis still make sense under a less optimistic scenario?

    This checklist is an educational framework, not a personalized investment recommendation.


    Common Value Trading Mistakes

    Relying on One Ratio

    A low P/E does not tell you everything about a business.

    Use multiple pieces of evidence rather than treating one ratio as the answer.

    Confusing a Falling Price With Value

    A stock becoming cheaper does not necessarily mean it is becoming more attractive.

    The underlying business may also be deteriorating.

    Ignoring Debt

    A business can look inexpensive on an earnings basis while carrying significant financial risk.

    Ignoring Industry Changes

    A company operating in a declining industry may deserve a lower valuation than it received in the past.

    Assuming Intrinsic Value Is Precise

    Intrinsic value is an estimate based on assumptions.

    Different models and assumptions can produce different results. CFA Institute notes that analysts often use multiple valuation models because inputs and applicability can vary.

    Forgetting the Time Horizon

    Even if an asset is genuinely undervalued, the market may not recognize that difference quickly.

    SEC disclosures on value-style investing explicitly identify the possibility that perceived intrinsic value may not be recognized for extended periods.


    How Value Trading Differs From Technical Trading

    Value-oriented analysis and technical analysis approach the market from different starting points.

    Value/Fundamental Analysis

    Focuses on:

    • Financial statements
    • Earnings
    • Cash flow
    • Assets
    • Debt
    • Business quality
    • Industry conditions
    • Valuation

    Technical Analysis

    Focuses more heavily on:

    • Price
    • Volume
    • Trends
    • Support and resistance
    • Chart patterns
    • Market momentum

    CFA Institute describes fundamental analysis as using economic, industry, and company information to estimate value, while technical analysis uses market information such as price and trading volume.

    Some market participants use both approaches, but they answer different questions.


    Can Value Trading Apply to Cryptocurrency?

    This is where traditional stock valuation and crypto analysis need to be separated.

    A public company generally has financial statements, earnings, assets, liabilities, cash flow, and potentially dividends. Many cryptocurrencies do not have these same characteristics.

    For example, a cryptocurrency may be evaluated using factors such as:

    • Network activity
    • Token supply
    • Token utility
    • Adoption
    • Liquidity
    • Developer activity
    • Market structure
    • Network economics
    • Competition
    • Regulatory conditions

    That means a traditional stock metric such as P/E cannot simply be transferred to Bitcoin or another token.

    OfferBin’s educational content explains that cryptocurrencies differ from traditional stocks because cryptoassets generally do not represent ownership of a company with conventional earnings and dividends.

    For readers interested in the broader relationship between crypto prices and market conditions, OfferBin’s guide on Bitcoin price and valuation factors provides additional context.

    If you’re researching crypto as a separate asset class, you can also explore OfferBin’s guide to crypto as an investment.


    How to Think About Value Trading in Practice

    A useful way to think about value trading is as a chain of questions:

    What does the asset cost?

    What might it be worth?

    How did I estimate that value?

    Why does the market price differ?

    What could make my valuation wrong?

    What could cause the market’s view to change?

    How much uncertainty is involved?

    This framework helps prevent valuation from becoming nothing more than a search for cheap-looking numbers.


    Frequently Asked Questions About Value Trading

    What is a value trade?

    A value trade is a market position based on the idea that an asset’s current market price may be below its estimated underlying or intrinsic value. For stocks, the analysis commonly involves financial statements, valuation ratios, cash flow, earnings, assets, growth prospects, and industry conditions.

    Is value trading the same as value investing?

    They overlap but are not necessarily identical. Value investing is generally a broader investment philosophy centered on buying securities that appear undervalued relative to intrinsic value. Value trading can describe a more specific position or strategy based on a perceived price-value discrepancy.

    How do you find undervalued stocks?

    Investors commonly examine valuation measures such as P/E, P/B, P/FCF, dividend yield and enterprise-value multiples alongside earnings, cash flow, debt, growth, industry conditions and business quality. No single metric proves that a stock is undervalued.

    What is intrinsic value?

    Intrinsic value is an estimate of what an asset is fundamentally worth based on its economic characteristics and expected future benefits. Because the calculation depends on assumptions, different analysts can reach different estimates.

    What is a value trap?

    A value trap is a security that appears inexpensive but remains inexpensive or declines because its underlying business is weaker than expected. A low valuation multiple alone does not eliminate this risk.

    Which ratios are useful for value investing?

    Commonly used measures include P/E, P/B, P/FCF, P/S, EV/EBITDA and dividend yield. Their usefulness depends on the company, industry and financial characteristics being analyzed.

    Is value trading short-term or long-term?

    The time horizon can vary. Value investing is often associated with longer-term holding periods because it may take time for a perceived valuation gap to close. A value-based trade can also have a shorter defined thesis or catalyst.

    What is the difference between market price and fair value?

    Market price is the current trading price. Fair value or intrinsic value is an estimate of what the asset may be worth based on an analytical model or valuation framework.

    Can a stock be cheap and still be overvalued?

    Yes. A stock can trade at a low valuation multiple because investors expect its earnings, cash flow or business prospects to deteriorate. A low price or low ratio does not automatically establish undervaluation.

    Does value trading guarantee profits?

    No. Valuation is uncertain, and the market can disagree with an investor’s estimate for a long time. A security that appears undervalued can fall further or fail to reach the estimated value.


    Final Thoughts on Value Trading

    The core idea behind a value trade is straightforward: compare what an asset costs with what you believe it may be worth.

    The difficult part is everything that comes after that comparison.

    A useful value analysis requires more than finding a low P/E ratio or a stock trading near its historical low. You need to understand the business, assess its financial position, estimate value using appropriate methods, examine the reasons behind the current price, and consider what could make your assumptions wrong.

    The most important distinction is between cheap and undervalued.

    A cheap security can be a genuine opportunity, but it can also be a value trap. Likewise, a company with a higher valuation can sometimes have stronger fundamentals and growth prospects that justify its price.

    For crypto markets, the analysis changes again because many digital assets do not have the same earnings, book value, dividends, or corporate cash flows as publicly traded companies.

    If you want to continue exploring market and digital-asset concepts, OfferBin provides educational resources and crypto market tools designed to help users research prices and digital assets.

    The goal of value analysis is therefore not simply to find the lowest price. It is to understand the relationship between price, value, fundamentals, expectations, and risk before drawing a conclusion.

  • VIX Futures Explained: How They Work, Pricing, Risks & Strategies

    VIX Futures Explained: How They Work, Pricing, Risks & Strategies

    VIX futures are exchange-traded contracts that allow market participants to gain exposure to the expected future level of the Cboe Volatility Index, or VIX. Unlike the spot VIX, which measures 30-day expected volatility of the S&P 500 from SPX option prices, a VIX future represents a market price for where the VIX is expected to be at a specific future expiration date.

    That distinction is the key to understanding VIX futures.

    The VIX can be 15 today while a VIX future expiring several weeks later trades at 18. Neither number is necessarily wrong. They represent different points in time.

    This guide explains how VIX futures work, how they are priced, why the futures curve moves into contango or backwardation, how expiration and settlement work, and how traders and portfolio managers use volatility futures for hedging or exposure.

    Quick answer: VIX futures are cash-settled futures contracts based on the future value of the VIX Index. They trade on the Cboe Futures Exchange and are commonly used for volatility exposure, hedging, speculation and relative-value strategies. Their prices can differ substantially from the current VIX because each contract reflects expectations for a particular future date.

    What Is the VIX Index?

    The Cboe Volatility Index (VIX) is designed to measure the market’s expectation of 30-day volatility for the S&P 500 Index.

    It is calculated from prices of a broad range of S&P 500 options rather than from the S&P 500’s historical price movements. Cboe’s methodology uses SPX and SPXW options and constructs a constant 30-day measure of expected volatility.

    The VIX is therefore different from realized volatility.

    • VIX: forward-looking expected volatility derived from option prices
    • Realized volatility: volatility calculated from actual historical price movements
    • S&P 500: the equity index whose option market supplies the inputs used in the VIX calculation

    The VIX is often called a market “fear gauge,” but that nickname can be misleading. The index is specifically a measure of expected volatility over approximately 30 days; it is not a direct prediction of whether the S&P 500 will rise or fall. Cboe also notes that the VIX is non-directional.

    What Are VIX Futures?

    VIX futures are futures contracts whose underlying reference is the VIX Index.

    The contracts are traded on the Cboe Futures Exchange and are cash-settled rather than physically delivered.

    The important concept is time.

    The current VIX represents the market’s 30-day expected volatility at the current point in time. A VIX futures contract, however, has a specific expiration date. Its price reflects the market’s expectation of the VIX level relevant to that future expiration.

    For example, imagine:

    Market instrumentHypothetical value
    Spot VIX today15
    Near-term VIX future16.50
    Second-month VIX future18
    Third-month VIX future19

    This does not mean traders are simply adding a fixed premium to the VIX.

    Each futures contract has its own maturity and reflects expectations about future volatility conditions.

    VIX Futures vs. Spot VIX

    This is one of the most important distinctions to understand.

    FeatureSpot VIXVIX Futures
    What it representsCurrent VIX Index levelExpected future VIX level represented by a contract price
    Time horizonConstant 30-day expected volatilitySpecific future expiration
    Tradable directly?The VIX Index itself is an index valueYes, through VIX futures contracts
    SettlementIndex calculationCash settlement
    Main referenceSPX option pricesMarket expectations about future VIX
    Can differ from the other?YesYes

    The VIX Index itself is calculated from SPX option prices. VIX futures are separate exchange-traded contracts with their own prices. Cboe provides both VIX index data and VIX futures market data separately.

    This explains why a VIX futures chart should never be treated as a simple copy of the spot VIX chart.

    How Do VIX Futures Work?

    VIX futures work similarly to other futures contracts in their basic structure: two parties agree to a contract whose value is determined by an underlying reference at a future date.

    The difference is that the underlying reference is the VIX.

    A simplified process looks like this:

    1. A VIX futures contract is listed with a future expiration date.
    2. Buyers and sellers trade that contract on CFE.
    3. Its price changes as expectations for future volatility change.
    4. The contract is marked to market through the futures settlement process.
    5. At expiration, the final value is determined using the VIX settlement process.
    6. The contract is cash-settled rather than delivering an asset.

    Cboe currently lists monthly and weekly VIX futures, giving market participants different expiration dates for volatility exposure.

    VIX Futures Contract Specifications

    Contract specifications can change, so traders should always check the latest Cboe documentation before trading.

    Cboe’s current contract specifications identify the VIX futures symbol as VX and show a 1,000 multiplier. The listed trading schedule includes extended and regular trading sessions.

    Contract featureVIX futures
    ProductCboe Volatility Index futures
    SymbolVX
    ExchangeCboe Futures Exchange
    SettlementCash
    Multiplier1,000
    ExpirationsMonthly and weekly contracts
    Final settlementVIX SOQ-based settlement
    TradingExtended and regular sessions

    The dollar value of a position depends on the futures price, multiplier and the number of contracts held.

    For example, if a hypothetical VX futures price is 18.00, its notional value based on the 1,000 multiplier would be:

    18.00 × 1,000 = $18,000

    That does not mean a trader necessarily pays $18,000 upfront to open the position. Futures are margined products, and the amount required to establish a position is different from its notional value.

    How Are VIX Futures Priced?

    VIX futures pricing is more complicated than simply taking today’s VIX and adding a premium.

    A futures price incorporates expectations about what the VIX may be at the contract’s expiration, along with market supply and demand, risk premiums, hedging demand, volatility expectations and the shape of the volatility term structure.

    This is why a VIX future can trade above or below the current spot VIX.

    Why Can VIX Futures Be Above the VIX?

    Suppose:

    • Spot VIX = 15
    • One-month VIX future = 17
    • Two-month VIX future = 18

    The curve is upward sloping.

    This is commonly called contango when later-dated futures are priced above nearer-dated contracts.

    It does not automatically mean that the market expects an immediate stock-market decline.

    Instead, it indicates that volatility futures for those future dates are priced at higher levels than the nearer contracts.

    Why Can VIX Futures Be Below the VIX?

    Now imagine:

    • Spot VIX = 30
    • One-month future = 25
    • Two-month future = 23

    This is consistent with a volatility term structure in which futures prices decline as expiration moves farther away.

    This condition can occur during periods when current volatility is unusually elevated and the market prices some normalization over time.

    The key point is that the VIX and VIX futures answer different time-horizon questions.

    What Is the VIX Futures Curve?

    The VIX futures curve is the relationship between VIX futures prices and their expiration dates.

    A simplified curve might look like this:

    ExpirationHypothetical VIX futures price
    Near month16
    Month 217
    Month 318
    Month 419
    Month 519.50

    The curve rises as expiration moves farther into the future.

    The curve can provide information about how volatility exposure is priced across different maturities.

    Cboe publishes VIX futures market data with multiple expiration dates, allowing traders to observe this term structure directly.

    Why Does the VIX Futures Curve Matter?

    Looking only at the spot VIX can hide important information.

    Two days could have the same spot VIX value but completely different futures curves.

    For example:

    Scenario A

    Spot VIX = 18
    Front future = 19
    Second future = 20
    Third future = 21

    Scenario B

    Spot VIX = 18
    Front future = 17
    Second future = 16
    Third future = 16

    The spot VIX is identical in both examples, but the term structure is very different.

    That difference can matter to anyone studying volatility exposure or the potential cost of maintaining a futures position over time.

    What Is VIX Futures Contango?

    VIX futures are in contango when later-dated futures are priced above nearer-dated futures.

    For example:

    ContractPrice
    Front month16
    Second month18
    Third month19
    Fourth month20

    The curve slopes upward.

    Contango is common enough in volatility products that it is an important concept for anyone studying VIX-related exposure.

    But there is a critical distinction:

    Contango is a description of the futures curve, not a guaranteed prediction about where the stock market is going.

    The curve can change rapidly as market expectations change.

    What Is VIX Futures Backwardation?

    Backwardation occurs when nearer-dated VIX futures trade above later-dated futures.

    Example:

    ContractPrice
    Front month30
    Second month26
    Third month24
    Fourth month23

    The curve slopes downward.

    Backwardation can occur when near-term volatility expectations are substantially elevated.

    However, backwardation should not automatically be interpreted as a certain forecast that equities will continue falling. Cboe has specifically discussed why the shape of the VIX curve should not be treated as a simple directional prediction for the future stock market.

    Contango vs. Backwardation

    FeatureContangoBackwardation
    Curve shapeUpward slopingDownward sloping
    Near-term futuresLowerHigher
    Later futuresHigherLower
    Common interpretationFuture volatility priced above near-term levelsNear-term volatility priced above later levels
    Guaranteed market forecast?NoNo

    The curve should be analyzed alongside market conditions rather than treated as a standalone trading signal.

    What Is the VIX Premium?

    The phrase VIX premium can refer to the tendency for VIX futures or volatility products to trade above the current spot VIX under certain market conditions.

    However, it is better to avoid treating every difference between the spot VIX and a futures contract as one simple “premium.”

    The difference can reflect:

    • Different time horizons
    • Expected mean reversion
    • Risk premiums
    • Hedging demand
    • Supply and demand
    • Volatility expectations
    • The structure of the futures market

    This distinction is especially important when comparing spot VIX with futures.

    A futures price of 20 when spot VIX is 17 does not mean the market has simply added a fixed 3-point insurance charge.

    The two values refer to different points in time.

    Why Do VIX Futures Often Differ From the VIX?

    Several factors can cause a difference.

    1. Different maturity

    The VIX is a constant 30-day expected-volatility measure.

    A VIX future may expire weeks or months from now.

    2. Mean reversion expectations

    The VIX has historically exhibited mean-reverting characteristics, although the timing and magnitude of any move toward historical levels are uncertain. Cboe notes the VIX tends to be mean reverting over time.

    3. Risk premiums

    Market participants may be willing to pay for volatility exposure because volatility can become particularly valuable during equity-market stress.

    4. Supply and demand

    Institutional hedging, speculative positioning and other market activity can affect futures prices.

    5. Changing market expectations

    A sudden increase in expected risk can cause near-term futures to move rapidly.

    How to Trade VIX Futures

    Trading VIX futures requires an understanding of futures mechanics, margin, contract specifications and volatility behavior.

    A general educational workflow is:

    Understand the contract

    Before considering a position, identify:

    • contract month
    • expiration date
    • multiplier
    • tick size
    • margin requirement
    • settlement mechanism

    Cboe publishes the official contract specifications and should be checked for current details.

    Study the entire curve

    Do not look at only one VIX futures contract.

    Compare several maturities.

    This helps show whether the curve is:

    • upward sloping
    • downward sloping
    • relatively flat
    • changing rapidly

    Consider the reason for the position

    VIX futures can be used for different purposes, including:

    • volatility exposure
    • portfolio hedging
    • tactical positioning
    • relative-value strategies
    • calendar spreads

    These uses have different risks.

    Understand margin

    Futures are leveraged instruments.

    The cash or margin required to establish a position can be much smaller than its notional exposure.

    That can magnify both gains and losses.

    Monitor expiration

    A VIX futures position does not simply continue indefinitely.

    Each contract has a specific expiration date and settlement process.

    VIX Futures Strategies

    There is no single universal VIX futures strategy. Different approaches are designed around different objectives and risk assumptions.

    Directional volatility exposure

    A trader may take a futures position based on a view about future volatility.

    The key risk is that the VIX futures price can move differently from the spot VIX.

    Calendar spreads

    A calendar spread involves taking positions in different VIX futures expirations.

    For example, a trader could compare a near-term contract with a later contract.

    The objective is to focus more on the relationship between maturities rather than simply betting on one absolute VIX level.

    Volatility hedging

    Portfolio managers can use volatility-related instruments as part of broader risk-management approaches.

    The concept is straightforward:

    If equity-market stress increases and volatility rises, a volatility position may offset some losses elsewhere in a portfolio.

    But the hedge is not guaranteed to work perfectly.

    Timing, contract selection, basis risk and the shape of the futures curve all matter.

    How VIX Futures Can Be Used for Hedging

    Suppose an investor has substantial exposure to an equity portfolio.

    The investor is concerned about a potential period of sharply increased volatility but does not necessarily want to sell the entire portfolio.

    A volatility hedge could be considered as one part of a broader risk-management framework.

    The important concept is offsetting exposure.

    If volatility rises sharply, a properly structured volatility position may gain value while the equity portfolio loses value.

    But there are several limitations.

    Hedge timing matters

    A volatility future can decline even when an investor expects equity-market uncertainty to remain elevated.

    The futures curve matters

    The selected contract may not respond exactly like the spot VIX.

    The hedge has carrying considerations

    Maintaining exposure across multiple expiration dates can produce different results depending on how the curve changes.

    A hedge can lose money

    Insurance-like protection has a cost, and a hedge may lose value when the expected adverse event does not occur.

    For these reasons, VIX futures should be understood as a risk-management instrument rather than a guaranteed portfolio protection mechanism.

    VIX Futures Expiration Explained

    VIX futures have specific expiration dates.

    For standard VIX futures, the last trading day is generally the expiration date, usually a Wednesday. Trading in an expiring contract ends at 9:00 a.m. ET on that day, according to Cboe’s current FAQ.

    VIX Weeklys futures provide additional expiration choices. Cboe says weekly VIX futures generally expire on Wednesdays and can provide more precise short-term exposure.

    Because contract schedules can change around holidays, traders should verify the official Cboe expiration calendar rather than relying on a generic rule.

    How Is VIX Futures Settlement Calculated?

    This is one of the most important technical points.

    VIX futures do not simply settle at whatever the screen shows for the VIX Index at the moment trading stops.

    The final settlement value for VIX futures and options is determined on expiration morning using a Special Opening Quotation (SOQ) of the VIX Index.

    The settlement process is based on prices of the relevant S&P 500 options.

    That means:

    Spot VIX ≠ necessarily final VIX futures settlement value.

    This is one reason traders should not assume that an expiring futures contract will settle at the immediately visible spot VIX number.

    Why Can Settlement Differ From Spot VIX?

    The ordinary VIX calculation and the final settlement calculation use different procedures and timing.

    The VIX is continuously calculated from eligible SPX option prices during its calculation periods.

    The final settlement value uses the SOQ process on expiration morning.

    Cboe describes the settlement process as being patterned after the settlement of A.M.-settled S&P 500 Index options and designed so that the relevant option prices used in settlement can be traded.

    Daily Settlement vs. Final Settlement

    These concepts should not be confused.

    Daily settlement

    A futures contract is marked to market using the exchange’s daily settlement process.

    Final settlement

    At expiration, the contract is settled against its final settlement value.

    For VIX derivatives, that final value is determined using the SOQ process.

    This distinction matters because a futures position can experience gains or losses before expiration even though the final settlement has not yet occurred.

    VIX Futures Trading Hours

    Cboe currently lists VIX futures as generally available for trading for approximately 23 hours per weekday, from Sunday evening through Friday afternoon, with a daily trading halt.

    The exact session structure can vary by product and holiday schedule.

    Always check the current exchange schedule before relying on a particular trading window.

    VIX Futures Margin Requirements

    VIX futures are leveraged derivatives, so traders must meet the applicable margin requirements.

    Margin is not the same thing as the full notional value of the contract.

    For example, a contract with a hypothetical notional value of $20,000 does not necessarily require $20,000 in margin.

    The actual requirement depends on the contract, market conditions, clearing rules and the brokerage’s requirements.

    Because margin requirements can change, the current exchange and broker documentation should be checked before trading.

    VIX Futures vs. VIX Options

    VIX futures and VIX options are both related to volatility, but they are different instruments.

    FeatureVIX FuturesVIX Options
    InstrumentFutures contractOption contract
    ExposureLong or short futuresCalls or puts
    ExpirationSpecific futures expirationSpecific option expiration
    SettlementCashCash
    Main riskFutures price movement and leveragePremium, volatility, time decay and option Greeks
    ComplexityHighHigh
    Common usesHedging, volatility exposure, spreadsHedging, directional and volatility strategies

    Cboe offers both VIX futures and options as separate products within its volatility complex.

    The appropriate instrument depends on the intended exposure and the risks the user understands.

    VIX Futures vs. VIX ETPs

    VIX futures should also be distinguished from exchange-traded products that obtain exposure to VIX futures.

    A VIX-related ETP may hold or reference a portfolio of futures rather than directly representing the spot VIX.

    That difference can create substantial performance differences over time.

    For example, an ETP that continually rolls futures can be affected by:

    • Contango
    • Backwardation
    • Roll timing
    • Management fees
    • Tracking differences
    • Changes in the futures curve

    Therefore, seeing that the VIX rose sharply does not automatically mean every VIX-linked product gained the same percentage.

    Key Risks of VIX Futures

    VIX futures can provide useful volatility exposure, but they involve significant risks.

    Leverage risk

    A relatively small amount of capital can control a much larger notional position.

    That increases the impact of price movements.

    Basis risk

    The VIX future may not move one-for-one with the spot VIX.

    Curve risk

    The shape of the futures curve can materially affect a position.

    Expiration risk

    The contract ultimately settles using the VIX settlement process rather than simply using an arbitrary intraday spot quote.

    Margin risk

    Large adverse moves can create additional margin requirements.

    Volatility shock risk

    VIX futures can move rapidly when markets experience sudden changes in risk expectations.

    Strategy risk

    A strategy that worked under one volatility regime may perform differently under another.

    Common VIX Futures Mistakes

    Mistake 1: Treating the VIX as a stock

    The VIX is an index calculated from options. It is not a company share.

    Mistake 2: Assuming VIX futures equal spot VIX

    They represent different time horizons.

    Mistake 3: Ignoring the futures curve

    Looking at one contract without comparing other maturities can hide important information.

    Mistake 4: Assuming contango predicts stocks will rise

    Contango describes the structure of futures prices. It is not a guaranteed stock-market forecast.

    Mistake 5: Assuming backwardation guarantees a crash

    Backwardation can accompany elevated near-term volatility, but it is not a guaranteed prediction of future equity returns.

    Mistake 6: Ignoring settlement mechanics

    The final VIX futures settlement is determined through the SOQ process.

    Mistake 7: Confusing notional value with margin

    The contract’s notional exposure and the amount required as margin are different concepts.

    Mistake 8: Focusing only on the front contract

    The broader curve can provide more context than a single futures price.

    A Simple VIX Futures Example

    Consider a hypothetical market:

    • Spot VIX: 16
    • One-month future: 18
    • Two-month future: 19.50
    • Three-month future: 20.25

    The futures curve is upward sloping.

    Now suppose market stress suddenly increases.

    The spot VIX jumps to 28.

    The futures curve might also rise, but the different contracts do not have to move by identical amounts.

    For example:

    InstrumentBeforeDuring stress
    Spot VIX1628
    One-month future1830
    Two-month future19.5028
    Three-month future20.2526

    These figures are purely illustrative.

    The example shows why “the VIX went up” is not enough information to determine how every VIX futures contract performed.

    Each maturity has its own supply, demand and expectations.

    Why VIX Futures Matter for Risk Management

    Volatility is an important part of market risk management because equity-market declines can coincide with rapid increases in expected volatility.

    VIX futures provide one way for sophisticated market participants to obtain exposure to that volatility environment.

    They can be used alongside other risk-management tools, including:

    • portfolio diversification
    • cash management
    • options
    • equity futures
    • position sizing
    • stop-loss frameworks
    • asset allocation
    • other hedging instruments

    No single instrument eliminates portfolio risk.

    For readers who also follow digital assets, it is useful to remember that crypto markets have their own volatility characteristics. OfferBin focuses on live crypto market information and token conversion rather than VIX futures trading, so its tools should not be interpreted as a substitute for a futures trading platform. OfferBin

    Frequently Asked Questions About VIX Futures

    What are VIX futures?

    VIX futures are cash-settled futures contracts traded on the Cboe Futures Exchange that provide exposure to the future level of the VIX Index. Each contract has a specific expiration date and its own market price.

    How do VIX futures work?

    VIX futures trade continuously during their applicable trading sessions and fluctuate according to expectations for future volatility, market supply and demand, and other factors. At expiration, they are cash-settled using the VIX settlement process.

    What is the difference between VIX and VIX futures?

    The VIX is a 30-day expected-volatility index calculated from S&P 500 option prices. A VIX future is a separate futures contract representing the market price associated with a future VIX settlement.

    Why are VIX futures often higher than the VIX?

    VIX futures can trade above the spot VIX when the futures curve is in contango. This can reflect expectations about future volatility, risk premiums and market positioning. It is not simply a fixed premium added to the spot index.

    What is VIX futures contango?

    Contango occurs when later-dated VIX futures are priced above nearer-dated futures. It describes the shape of the futures curve and should not automatically be treated as a forecast for stock-market direction.

    What is VIX futures backwardation?

    Backwardation occurs when nearer-dated VIX futures are priced above later-dated contracts. It can occur when near-term volatility expectations are elevated.

    Can you buy VIX futures?

    Eligible market participants can trade VIX futures through a futures brokerage that provides access to the Cboe Futures Exchange. The VIX Index itself is not something an investor simply buys like a stock.

    How are VIX futures settled?

    VIX futures are cash-settled. Their final settlement value is determined through a Special Opening Quotation of the VIX Index on the expiration date.

    When do VIX futures expire?

    Standard VIX futures generally expire on Wednesdays, although holidays can change the applicable schedule. Weekly VIX futures also generally expire on Wednesdays.

    What is the VIX futures curve?

    The VIX futures curve shows the prices of VIX futures across different expiration dates. It helps market participants examine how volatility exposure is priced across maturities.

    Are VIX futures the same as VIX options?

    No. VIX futures are futures contracts, while VIX options are options contracts. They have different payoff structures, risks and pricing characteristics.

    Are VIX futures the same as VIX ETPs?

    No. Many VIX-related exchange-traded products obtain exposure through VIX futures rather than directly tracking the spot VIX. Their performance can therefore differ significantly from changes in the VIX Index.

    What is the VIX futures multiplier?

    Cboe’s current VIX futures specifications list a 1,000 multiplier. Traders should verify current specifications before trading because exchange rules and product details can change.

    Do VIX futures track the VIX exactly?

    No. A VIX futures contract represents a future expiration and can trade above or below the current spot VIX.

    Why can VIX futures rise less than the VIX?

    Different contracts respond to different expectations and time horizons. A sudden spike in near-term volatility may affect the front contract more than later contracts.

    Can VIX futures be used for hedging?

    They can be used as one component of volatility hedging strategies. However, hedge effectiveness depends on timing, contract selection, the futures curve and the behavior of the underlying portfolio.

    Is VIX futures trading risky?

    Yes. Futures involve leverage and can produce substantial gains or losses. Margin requirements, rapid volatility changes, curve movements and settlement mechanics all need to be understood before trading.

    Does a high VIX mean the stock market will fall?

    Not necessarily. The VIX measures expected volatility rather than the direction of the S&P 500. A high VIX can occur during falling markets, but the index itself is not a directional forecast.

    VIX Futures: Key Takeaways

    ConceptWhat to remember
    VIXMeasures 30-day expected S&P 500 volatility
    VIX futuresContracts based on future VIX settlement
    Spot vs futuresThey represent different time horizons
    Futures curveShows prices across expiration dates
    ContangoLater contracts priced above nearer contracts
    BackwardationNearer contracts priced above later contracts
    SettlementCash settlement using the VIX SOQ process
    HedgingCan provide volatility exposure but is not guaranteed protection
    MarginFutures exposure is leveraged
    Main lessonNever assume a VIX futures price equals the spot VIX

    Final Thoughts

    VIX futures are best understood as forward-looking volatility contracts, not as a simple way to buy the VIX.

    The most important concepts are the relationship between the VIX and its futures, the shape of the futures curve, contango and backwardation, and the difference between daily trading prices and final settlement.

    For beginners, the simplest mental model is:

    VIX = current 30-day expected volatility measure

    👉VIX future = market price associated with the VIX at a future expiration

    VIX futures curve = how those future volatility prices change across maturities

    Once those three ideas are clear, concepts such as VIX futures pricing, hedging, roll exposure, expiration and settlement become much easier to understand.

    Because VIX futures are leveraged financial derivatives, anyone considering actual trading should review the latest exchange specifications, brokerage requirements and risk disclosures rather than relying solely on an educational article.

    For additional market-data and crypto resources, you can explore OfferBin’s resources. OfferBin provides live crypto prices and token conversion for reference; it does not execute VIX futures or other futures trades.

  • What Is a Brokerage Account? How It Works, Types & Fees

    What Is a Brokerage Account? How It Works, Types & Fees

    A brokerage account is an investment account that lets you buy and sell securities such as stocks, bonds, exchange-traded funds (ETFs), and mutual funds through a brokerage firm. Unlike a bank account, which is mainly designed for deposits and payments, a brokerage account is designed to hold investments and cash used for investing.

    In simple terms, think of a brokerage account as a home for your investments. You deposit money into the account, use that money to purchase investments, and the brokerage keeps a record of what you own. When you sell an investment, the proceeds generally return to the account as cash.

    This guide explains what a brokerage account is, how brokerage accounts work, the main types, fees, taxes, risks, and how beginners can open and use one.

    What Is a Brokerage Account?

    A brokerage account is an investment account held with a brokerage firm that allows you to buy and sell financial securities.

    Depending on the brokerage and account, you may be able to invest in:

    • Stocks
    • Bonds
    • ETFs
    • Mutual funds
    • Options
    • Other securities and investment products

    The exact investments available vary by brokerage firm and account type. Investor.gov defines a brokerage account as an investment account at a registered brokerage firm that allows investors to buy and sell products such as stocks, bonds, mutual funds, and ETFs.

    The simplest way to understand it

    A brokerage account is not the investment itself.

    For example:

    • Brokerage account: The account where your investments and available cash are held.
    • Stock: An investment you can purchase through the account.
    • ETF: Another investment you can purchase through the account.
    • Broker: The intermediary that provides access to the market and executes orders.
    • Portfolio: The collection of investments you hold.

    So if you deposit $5,000 into a brokerage account and use $2,000 to purchase an ETF, the brokerage account is the container holding your cash and investment position.


    How Does a Brokerage Account Work?

    The basic process is straightforward:

    1. You open an account with a brokerage firm.
    2. You provide the required information and verify your identity.
    3. You deposit money.
    4. You choose an investment.
    5. You submit a buy order.
    6. The broker processes the transaction.
    7. The investment appears in your account.
    8. You can monitor, hold, or eventually sell the investment.

    A simple example

    Suppose you open a brokerage account and deposit $1,000.

    You decide to invest $600 in an ETF and leave $400 as cash.

    Your account might then show:

    HoldingAmount
    ETF$600
    Available cash$400
    Total account value$1,000

    If the ETF rises in value, your investment becomes worth more. If it falls, its value decreases.

    The brokerage account itself does not guarantee that your investments will increase. Investment values can rise or fall based on market conditions.

    Brokerage firms act as intermediaries between investors and financial markets, helping customers place orders to buy and sell investments.


    What Is a Brokerage Account Used For?

    People use brokerage accounts for several investing purposes.

    Buying and selling investments

    The most basic use is buying and selling securities such as stocks, bonds, ETFs, and mutual funds.

    Building an investment portfolio

    You can hold multiple investments in one account to create a portfolio.

    For example, a portfolio could contain:

    • U.S. stocks
    • International stocks
    • Bond funds
    • ETFs
    • Cash

    The actual combination depends on the investor’s goals, time horizon, risk tolerance, and investment strategy.

    Investing for long-term goals

    A taxable brokerage account can provide flexibility for goals that do not fit neatly inside a retirement account.

    Some investors use brokerage accounts alongside retirement accounts rather than as a replacement for them.

    Holding investments

    A brokerage account also provides a place to keep investments after you purchase them.

    You can generally view:

    • Current holdings
    • Account balance
    • Cash balance
    • Investment values
    • Transaction history
    • Gains and losses

    What Can You Buy With a Brokerage Account?

    The available investments depend on the brokerage firm, but common choices include:

    InvestmentWhat it represents
    StocksOwnership interests in companies
    BondsDebt issued by governments or organizations
    ETFsFunds that trade on an exchange
    Mutual fundsPooled investments managed according to a stated strategy
    OptionsContracts tied to an underlying security or asset
    CashUninvested money held in the account

    Not every brokerage offers every product.

    For example, one brokerage may provide stocks, ETFs, and mutual funds while another may offer a much broader selection of securities and trading tools.

    If you’re learning about different asset classes, understanding how digital assets differ from traditional securities is also useful. OfferBin’s educational coverage includes an explanation of how cryptocurrency differs from traditional investments, although OfferBin itself is not a brokerage or exchange.


    Types of Brokerage Accounts

    There are several ways brokerage accounts can be classified.

    The most important distinction for beginners is usually cash vs. margin.

    Other classifications include individual vs. joint ownership and self-directed vs. managed accounts.


    Cash Brokerage Account

    A cash account requires you to pay the full amount for securities you purchase rather than borrowing money from the brokerage.

    For example, if you have $2,000 available and purchase $1,500 of investments, you are using your own available funds.

    Investor.gov defines a cash account as a brokerage account in which the investor must pay the full amount for securities purchased and cannot borrow from the broker to fund those purchases.

    Why cash accounts matter

    A cash account is simpler because you are not borrowing money from the brokerage.

    However, cash accounts still have trading rules. For example, U.S. securities transactions are subject to settlement and other regulatory requirements, and certain trading activity in cash accounts can result in restrictions. The SEC updated its investor bulletin on cash-account trading in August 2026.


    Margin Brokerage Account

    A margin account allows a brokerage firm to lend money to an investor to purchase securities, using securities in the account as collateral.

    For example, suppose you have $5,000 in an account and a brokerage allows you to borrow additional money.

    You could potentially purchase more securities than you could with your cash alone.

    But borrowing creates additional risk.

    You may have to:

    • Pay interest on borrowed money
    • Maintain required account equity
    • Deposit additional cash or securities if the account falls below requirements
    • Potentially have securities sold by the brokerage to cover a shortfall

    Investor.gov warns that margin trading can result in larger losses and that a brokerage may sell securities to address a margin deficiency.

    Cash account vs. margin account

    FeatureCash AccountMargin Account
    Uses your own fundsYesYes
    Borrowing from brokerNoYes
    Interest on borrowed moneyNoPossible
    Purchasing powerLimited to available fundsCan be increased through borrowing
    RiskInvestment riskInvestment + borrowing risk
    Beginner complexityLowerHigher

    When opening an account, pay attention to the account type you are selecting. The SEC specifically warns that some brokerage applications may make margin the default option, so investors should confirm which type they are opening.


    Individual Brokerage Account

    An individual brokerage account has one account owner.

    The account holder generally controls the investments and transactions.

    This is one of the most common structures for personal investing.


    Joint Brokerage Account

    A joint brokerage account has multiple owners.

    It may be used by spouses, partners, or other eligible individuals, depending on the brokerage and applicable rules.

    Ownership, withdrawal rights, taxes, and other details can vary, so the account agreement matters.


    Self-Directed Brokerage Account

    With a self-directed account, you generally decide what investments to buy and sell.

    The brokerage provides the platform, account infrastructure, market access, and order execution, while you make the investment decisions.

    This can provide greater control, but it also means you are responsible for researching investments and understanding the risks.


    Managed Brokerage Account

    A managed brokerage account may involve a financial professional or automated investment service managing investments according to an agreed approach.

    A robo-advisor, for example, may use software to construct and manage a portfolio based on information supplied by the customer.

    The services, fees, investment choices, and management arrangements vary between providers.


    How Much Does a Brokerage Account Cost?

    Opening a brokerage account may cost nothing at some firms, but that does not mean investing is completely free.

    Potential costs can include:

    • Trading commissions
    • Account maintenance fees
    • Transfer fees
    • Wire fees
    • Margin interest
    • Fund expense ratios
    • Options contract fees
    • Other transaction-related costs

    The exact fee structure depends on the brokerage and products you use.

    Some online brokers advertise commission-free trading for certain products, but investors should still review the complete fee schedule.

    Why fees matter

    Suppose two investments have similar performance before costs.

    If one carries higher ongoing costs, those costs can reduce the amount of money that remains invested.

    This is why comparing the complete fee structure is more useful than looking only at a headline such as “$0 commission.”


    Are Brokerage Accounts Taxable?

    Whether and how a brokerage account is taxed depends on the account type, investments, transactions, and your tax jurisdiction.

    For a typical taxable brokerage account in the United States, investment income can include items such as:

    • Capital gains
    • Dividends
    • Interest

    The IRS lists capital gains, interest, and dividends among types of investment income that may be taxable.

    Example

    Suppose you buy shares for $2,000 and later sell them for $2,500.

    The $500 difference may represent a capital gain for tax purposes, subject to applicable rules and circumstances.

    Tax treatment can become more complicated depending on:

    • How long you held the investment
    • Your tax status
    • The type of investment
    • Whether losses offset gains
    • Your country or state
    • Applicable tax laws

    Because tax rules change and vary by jurisdiction, investors should consult current tax guidance or a qualified tax professional for their own situation.


    Brokerage Account vs. Bank Account

    A brokerage account and a bank account serve different primary purposes.

    FeatureBrokerage AccountBank Account
    Main purposeInvestingSaving, payments, and cash management
    StocksUsually availableGenerally not held directly
    ETFsUsually availableGenerally not held directly
    BondsOften availableGenerally not held directly
    Investment riskYesDepends on the product
    Investment gains/lossesPossibleUsually not the main purpose
    Payment servicesLimited/variesCommon
    Deposit insuranceDepends on structure and jurisdictionDepends on bank and applicable insurance

    A bank account is generally designed around cash deposits and payments, while a brokerage account is designed around investments.

    The two can work together.

    For example:

    Bank account → transfer money → brokerage account → purchase investments


    Brokerage Account vs. Retirement Account

    A brokerage account is also different from a retirement account such as an IRA or 401(k).

    The exact rules depend on the jurisdiction and account type, but U.S. retirement accounts generally have specific tax rules and contribution restrictions that do not apply in the same way to ordinary taxable brokerage accounts.

    FeatureTaxable BrokerageRetirement Account
    Main purposeGeneral investingRetirement savings
    Investment choicesOften broadDepends on plan/provider
    Tax treatmentGenerally taxableSpecial tax treatment
    Contribution rulesGenerally no annual federal contribution limit like an IRAContribution rules may apply
    Withdrawal rulesGenerally flexibleSpecial rules may apply
    Employer contributionNoSome employer plans may offer matching

    A brokerage account can therefore complement retirement savings rather than necessarily replacing a retirement account.


    Is a Brokerage Account Safe?

    There are two separate questions here:

    1. Is the account protected if the brokerage fails?
    2. Can investments inside the account lose money?

    Those are not the same thing.

    In the United States, eligible customers of SIPC-member brokerage firms may receive protection when a brokerage firm fails and customer assets are missing, subject to applicable limits. SIPC protection is generally up to $500,000 per customer, including a $250,000 limit for cash claims. It does not protect you from normal investment losses caused by market prices falling.

    Important distinction

    If you buy a stock for $1,000 and it falls to $700, that is a market loss.

    SIPC protection is not designed to reimburse you simply because the stock declined.

    That distinction is essential when evaluating brokerage-account safety.


    How to Open a Brokerage Account

    Opening a brokerage account generally involves several steps.

    Choose a brokerage firm

    Compare factors such as:

    • Fees
    • Available investments
    • Account types
    • Trading tools
    • Customer support
    • Educational resources
    • Minimums
    • Regulatory information
    • Cash-management options

    Complete the application

    Depending on the jurisdiction and brokerage, you may need to provide information such as:

    • Full name
    • Address
    • Identification information
    • Employment information
    • Financial information
    • Investment experience

    The specific requirements vary.

    Select the account type

    You may need to choose between:

    • Cash
    • Margin
    • Individual
    • Joint
    • Managed
    • Self-directed

    Do not select margin simply because it is presented as an option. Understand how borrowing works before enabling it.

    Fund the account

    You can generally transfer money from an eligible bank account or another permitted funding source.

    The available methods depend on the brokerage.

    Choose your investments

    Once the account is funded, you can research investments available through that brokerage and place orders according to your own strategy.

    Opening the account does not automatically mean your money is invested. Funding an account and investing the money are separate steps.


    How to Use a Brokerage Account as a Beginner

    If you are new to investing, focus first on understanding how the account works.

    Understand what you own

    Know the difference between:

    • Cash
    • Individual stocks
    • Bonds
    • ETFs
    • Mutual funds
    • Other securities

    Learn basic order types

    Two common order types are:

    Market order: An instruction to buy or sell at the best available price under the order’s conditions.

    Limit order: An instruction to buy or sell only at a specified price or better.

    The availability and mechanics of order types can vary between brokerages and securities.

    Understand diversification

    Putting all of your money into one investment exposes the portfolio to the risks of that investment.

    Diversification spreads exposure across different investments or asset categories, although diversification cannot eliminate investment losses.

    Understand your fees

    Review both obvious and less-obvious costs.

    A brokerage with no trading commission can still have other fees or costs associated with certain services or investments.

    Be careful with margin

    Borrowing can increase purchasing power, but it can also increase losses and introduce interest costs and margin requirements.


    Can You Withdraw Money From a Brokerage Account?

    Generally, you can withdraw available cash from a brokerage account, subject to the brokerage’s policies and any applicable restrictions.

    But there is an important distinction between cash available to withdraw and money invested in securities.

    If your money is invested, you may need to sell the investment first.

    For example:

    Investment → sell → proceeds become available cash → withdraw

    Selling an investment can have tax consequences in some jurisdictions.

    There can also be settlement-related timing before sale proceeds become fully available, depending on the security and applicable market rules.


    How Does a Brokerage Account Make Money?

    A brokerage firm may generate revenue in several ways depending on its business model.

    Potential sources include:

    • Commissions
    • Account fees
    • Interest on margin loans
    • Interest earned on certain customer cash arrangements
    • Fees for specific services
    • Fund or product-related revenue
    • Other permitted business activities

    Not every brokerage uses the same model.

    This is why reading the firm’s fee schedule and disclosures is more useful than assuming that a “commission-free” account has no costs.


    What Are the Benefits of a Brokerage Account?

    Common benefits include:

    • Access to a broad range of investments
    • Flexible withdrawals
    • Ability to build a diversified portfolio
    • Access to online investing tools
    • No annual contribution limit comparable to an IRA in a standard U.S. taxable account
    • Ability to invest for goals outside retirement
    • Choice between self-directed and managed approaches, depending on the provider

    The specific benefits depend on the brokerage, account structure, investments, and jurisdiction.


    What Are the Disadvantages of a Brokerage Account?

    A brokerage account also has limitations and risks.

    Market losses

    Investments can lose value.

    Taxes

    Taxable investment income and realized gains may create tax obligations.

    Fees

    Certain services and investments can involve costs.

    Complexity

    Some investments and trading features can be difficult for beginners to understand.

    Margin risk

    Borrowing can increase both purchasing power and potential losses.

    Emotional decision-making

    Markets can move quickly, and reacting impulsively to short-term price changes can affect investment decisions.

    A brokerage account provides access to markets; it does not remove investment risk.


    Common Brokerage Account Mistakes

    Confusing the account with the investment

    A brokerage account is the account structure. A stock, ETF, or bond is an investment held through that account.

    Choosing margin without understanding it

    Margin introduces borrowing, interest, collateral requirements, and additional risk.

    Looking only at commissions

    A $0 commission does not necessarily mean $0 total cost.

    Ignoring taxes

    Selling investments for a gain or receiving dividends or interest can have tax implications.

    Investing before understanding the product

    Before buying an investment, understand what it is, how it works, and what could cause its value to rise or fall.

    Assuming protection means guaranteed returns

    Investor protection mechanisms and investment performance are separate issues.


    Brokerage Account FAQ

    What is a brokerage account in simple words?

    A brokerage account is an investment account that lets you buy, sell, and hold investments such as stocks, bonds, ETFs, and mutual funds through a brokerage firm.

    How does a brokerage account work?

    You deposit money into the account, use available funds to purchase investments, and the brokerage records and maintains your positions. When you sell an investment, the proceeds generally return to the account as cash.

    Can beginners open a brokerage account?

    Yes. Many brokerage firms offer accounts designed for individual investors, including beginners. The eligibility requirements and available products vary by provider and jurisdiction.

    How much money do you need to open a brokerage account?

    There is no single minimum that applies to every brokerage. Some firms may allow accounts with no minimum deposit, while others may impose account or product-specific requirements.

    What can you buy with a brokerage account?

    Depending on the brokerage, you may be able to buy stocks, bonds, ETFs, mutual funds, options, and other securities.

    Is a brokerage account the same as a bank account?

    No. A bank account is primarily designed for cash deposits, payments, and banking services, while a brokerage account is designed for buying, selling, and holding investments.

    Do you pay taxes on a brokerage account?

    Tax treatment depends on the account, investment, transaction, and jurisdiction. In the U.S., taxable investment accounts can generate taxable capital gains, dividends, and interest.

    Can you withdraw money from a brokerage account?

    Generally, yes, if the money is available for withdrawal. If your money is invested, you may need to sell the investment first, and selling can have tax consequences.

    What is the difference between a cash account and a margin account?

    A cash account requires you to pay the full amount for securities you purchase. A margin account allows you to borrow from the brokerage to purchase securities, which introduces interest costs and additional risk.

    Is a brokerage account safe?

    A brokerage account can have investor-protection mechanisms depending on the country, brokerage, and account structure. In the U.S., eligible customers of SIPC-member firms may receive protection against certain losses caused by brokerage failure, but SIPC does not protect against normal market losses.

    Can you have more than one brokerage account?

    Yes, investors can have multiple brokerage accounts when permitted by the providers and applicable rules. Different accounts may be used for different investment goals, providers, or strategies.

    Is a brokerage account good for investing?

    A brokerage account provides access to investments, but whether it fits a particular investor depends on factors such as goals, time horizon, risk tolerance, tax situation, and available alternatives.


    Brokerage Account: Key Takeaways

    A brokerage account is essentially an investment account that provides access to financial markets.

    The most important points to remember are:

    • A brokerage account is different from an individual investment.
    • You can use it to buy and sell securities.
    • Stocks, bonds, ETFs, and mutual funds are common investments.
    • Cash and margin accounts work differently.
    • Margin involves borrowing and additional risk.
    • Brokerage fees vary between firms and products.
    • Tax treatment depends on the account, investment, transaction, and jurisdiction.
    • Investor protection does not eliminate market risk.
    • You can generally withdraw available cash, but selling investments first may be necessary.
    • Opening a brokerage account and actually investing the money are two separate steps.

    For readers who also follow digital assets, it is important to keep another distinction clear: a brokerage account is not the same thing as a crypto exchange account or crypto wallet. OfferBin itself is a live crypto price tracker and token converter, not a crypto exchange or brokerage; its converter is for reference and does not move or store funds.

    For more educational market and digital-asset resources, you can explore OfferBin’s market guides and use its live data tools to check current crypto prices and token conversions.


    Sources & Further Reading

    For financial definitions and regulatory information, useful primary sources include:

    These sources are particularly useful because brokerage rules, tax treatment, settlement requirements, and investor-protection rules can change over time.

  • Best Futures to Trade in 2026: Top Contracts Compared

    Best Futures to Trade in 2026: Top Contracts Compared

    If you’re looking for the best futures to trade in 2026, start with one important point: there is no single futures contract that is best for every trader.

    The right market depends on liquidity, volatility, contract size, tick value, trading hours, strategy, and how much risk you can realistically manage. Popular choices include S&P 500 futures (ES/MES), Nasdaq-100 futures (NQ/MNQ), crude oil (CL/MCL), gold (GC/MGC), Russell 2000 futures, Dow futures, and 10-Year Treasury futures.

    For many traders, the most useful starting point is a highly liquid market with a contract size that matches their risk plan. Smaller contracts can also provide more precise position sizing. CME’s E-nano equity-index futures, launched in August 2026, add another smaller-sized option for four major U.S. equity benchmarks.

    Quick answer: The best futures to research in 2026 include ES/MES, NQ/MNQ, CL/MCL, GC/MGC, RTY/M2K, YM/MYM, and ZN. Instead of choosing solely by popularity, compare liquidity, volatility, tick value, contract size, trading session, and your maximum acceptable risk.

    Best Futures to Trade in 2026 at a Glance

    Futures marketCommon contractsMain exposureOften useful forKey consideration
    S&P 500ES / MESU.S. large-cap stocksDay trading, index exposureHighly liquid, but still leveraged
    Nasdaq-100NQ / MNQU.S. technology-heavy equitiesMomentum and active tradingCan experience larger price swings
    Russell 2000RTY / M2KU.S. small-cap stocksIndex diversification, momentumCan behave differently from large-cap indexes
    Dow JonesYM / MYM30 large U.S. companiesIndex tradingDifferent composition and movement profile
    WTI Crude OilCL / MCLEnergyCommodity trading, macro/newsCan move sharply around energy events
    GoldGC / MGCPrecious metalsMacro and metals exposureSensitive to rates, dollar and geopolitical conditions
    10-Year TreasuryZNU.S. interest ratesRates and macro tradingRequires understanding bond-price/yield relationships
    E-nano indexesNES / NNQ / N2K / NDOWMajor U.S. indexesSmaller-scale equity-index exposureNewer products with smaller multipliers

    The table is a starting point, not a ranking. Contract specifications, liquidity and market conditions can change, so traders should verify current specifications before placing trades.

    What Makes a Futures Contract Good to Trade?

    A futures contract becomes attractive for different reasons depending on the trader. Popularity alone is not enough.

    Five characteristics matter particularly:

    1. Liquidity
    2. Volatility
    3. Contract size
    4. Tick value
    5. Execution conditions

    CME explains that traders can evaluate futures liquidity using measures such as trading volume, open interest, bid/offer spreads and order-book depth.

    Liquidity

    Liquidity describes how easily you can enter or exit a position without causing a large price impact.

    Highly liquid futures markets generally offer:

    • More active participation
    • More trading volume
    • Tighter bid-ask spreads
    • Greater market depth
    • Potentially less slippage under normal conditions

    However, liquidity can change during different trading sessions and around major economic announcements.

    Trading Volume

    Volume measures how many contracts change hands during a specified period.

    High volume can indicate active participation, but volume alone does not tell you everything about execution quality. You should also consider the spread and available depth near the current price.

    Open Interest

    Open interest represents outstanding futures positions that remain open.

    It is different from daily trading volume. Volume measures contracts traded during a period, while open interest reflects contracts that remain open.

    Bid-Ask Spread

    The bid is the highest displayed price buyers are offering, while the ask is the lowest displayed price sellers are requesting.

    A smaller spread can reduce one component of transaction cost, although commissions, exchange fees and slippage also matter.

    Market Depth

    Market depth shows the quantity of orders available at different price levels.

    A market can have high volume but still behave differently during a major news event when liquidity conditions change rapidly.


    How Does Volatility Affect Futures Trading?

    Volatility describes how much and how quickly a market’s price moves.

    High volatility can create more trading opportunities, but it also increases the potential size of losses.

    This distinction is especially important with futures because leverage means a relatively small amount of posted margin can control a much larger notional position.

    The CFTC warns that leverage can amplify both gains and losses and that futures traders can be required to add funds when positions move against them.

    High-volatility futures

    Markets such as Nasdaq-100 futures and crude oil futures can experience significant intraday movement.

    That can appeal to momentum or short-term traders, but larger movements also require careful position sizing.

    Lower-volatility does not mean low risk

    A market with smaller average price movements can still create substantial losses if the contract is too large for the account.

    The important question is not:

    “Which futures market moves the most?”

    It is:

    “Which contract’s normal movement can I manage within my risk plan?”


    Best Equity Index Futures to Trade in 2026

    Equity index futures are among the most widely followed futures markets because they provide exposure to major stock-market benchmarks.

    The main contracts worth understanding are ES, NQ, RTY and YM, along with their smaller-sized alternatives.

    S&P 500 Futures: ES and MES

    E-mini S&P 500 futures (ES) track the S&P 500 index and use a $50 multiplier. A 0.25-point minimum tick therefore represents $12.50 per contract.

    Micro E-mini S&P 500 futures (MES) use a smaller multiplier of $5.

    That makes MES useful when a trader wants exposure to the same benchmark with a smaller contract size.

    Why traders watch ES

    ES can be attractive for traders who want:

    • Broad U.S. large-cap equity exposure
    • A heavily followed benchmark
    • Active intraday markets
    • A market connected to major U.S. economic events

    ES vs MES

    FeatureESMES
    UnderlyingS&P 500S&P 500
    Multiplier$50$5
    Relative size1x1/10 ES
    Tick size0.25 index point0.25 index point
    Tick value$12.50$1.25
    Main benefitLarger exposureSmaller exposure

    The smaller contract does not remove market risk. It simply reduces the dollar impact of each index movement.


    Nasdaq-100 Futures: NQ and MNQ

    E-mini Nasdaq-100 futures (NQ) provide exposure to the Nasdaq-100.

    NQ uses a $20 multiplier, while Micro E-mini Nasdaq-100 futures (MNQ) use a $2 multiplier.

    Why traders watch NQ

    Nasdaq-100 futures are closely associated with large technology and growth-oriented companies.

    They can be relevant for traders focused on:

    • Momentum
    • Technology-related market moves
    • U.S. equity indexes
    • Intraday price movement

    But greater movement can also mean greater risk.

    NQ vs MNQ

    FeatureNQMNQ
    UnderlyingNasdaq-100Nasdaq-100
    Multiplier$20$2
    Relative size1x1/10 NQ
    Primary advantageLarger exposureSmaller exposure

    For traders comparing NQ and MNQ, contract size should be one of the first considerations.


    Russell 2000 Futures: RTY and M2K

    Russell 2000 futures provide exposure to a U.S. small-cap equity benchmark.

    The standard contract is RTY, while Micro E-mini Russell 2000 futures (M2K) provide a smaller contract size.

    Russell futures can behave differently from large-cap indexes because smaller companies may respond differently to changes in interest rates, domestic economic expectations and market sentiment.

    They can therefore be useful for traders who specifically want small-cap exposure rather than simply another version of the S&P 500.


    Dow Futures: YM and MYM

    E-mini Dow futures (YM) provide exposure to the Dow Jones Industrial Average.

    The Micro E-mini Dow contract, MYM, provides a smaller contract size.

    Dow futures can appeal to traders who want an equity-index market with a different composition from the S&P 500 and Nasdaq-100.

    The key point is not that YM is inherently better or worse than ES or NQ. Its usefulness depends on the exposure and price behavior you’re looking for.


    Best Commodity Futures to Trade in 2026

    Commodity futures can behave differently from equity indexes because supply, demand, weather, inventories, geopolitical events and macroeconomic conditions can have a direct impact on prices.

    Two major markets to understand are crude oil and gold.

    Crude Oil Futures: CL and MCL

    WTI crude oil futures (CL) represent 1,000 barrels, with a minimum tick of $0.01 per barrel and a $10 tick value.

    Micro WTI crude oil futures (MCL) represent 100 barrels and have a $1 tick value.

    Why crude oil attracts traders

    WTI is influenced by factors including:

    • OPEC decisions
    • Inventory data
    • Energy demand
    • Geopolitical events
    • Global economic conditions
    • Production expectations

    CME notes that WTI traders commonly watch the EIA Weekly Petroleum Status Report and OPEC developments.

    CL vs MCL

    FeatureCLMCL
    Contract size1,000 barrels100 barrels
    Tick size$0.01$0.01
    Tick value$10$1
    Relative size1x1/10 CL
    Main differenceLarger exposureSmaller exposure

    Crude oil can move quickly around scheduled reports and unexpected geopolitical developments, so a smaller contract does not automatically make the market easy.


    Gold Futures: GC and MGC

    Gold futures (GC) represent 100 troy ounces, with a minimum price fluctuation of $0.10 per ounce, equivalent to $10 per tick. Micro Gold futures (MGC) represent 10 troy ounces and have a $1 tick value.

    Gold prices can respond to:

    • Interest-rate expectations
    • Inflation expectations
    • U.S. dollar movements
    • Geopolitical uncertainty
    • Central-bank policy
    • Global economic conditions

    CME describes GC as a major gold futures market and notes its relationship with broader macroeconomic factors.

    GC vs MGC

    FeatureGCMGC
    Contract size100 troy oz.10 troy oz.
    Tick size$0.10/oz.$0.10/oz.
    Tick value$10$1
    Relative size1x1/10 GC

    Gold can look familiar because it is widely discussed in financial news, but familiarity does not eliminate futures leverage risk.


    10-Year Treasury Futures: ZN

    10-Year U.S. Treasury Note futures (ZN) are used to trade exposure to the U.S. Treasury market and interest-rate expectations.

    CME lists ZN with a $100,000 face amount at maturity and provides electronic trading access through CME Globex.

    Treasury futures are different from equity and commodity futures because their price behavior is closely connected to:

    • Interest-rate expectations
    • Federal Reserve policy
    • Inflation data
    • Employment data
    • Economic growth expectations
    • Demand for government securities

    For traders who understand fixed-income markets, ZN can be an important futures market. For beginners who do not understand the price-yield relationship, it may require more study before trading.


    Micro Futures vs E-mini Futures vs E-nano Futures

    One of the most important developments for futures traders in 2026 is the expansion of smaller-sized equity-index contracts.

    CME launched its E-nano equity-index futures on August 24, 2026, covering the S&P 500, Nasdaq-100, Russell 2000 and Dow Jones Industrial Average.

    What Are Micro Futures?

    Micro E-mini contracts are generally one-tenth the size of their corresponding E-mini equity-index contracts.

    For example:

    • ES → MES
    • NQ → MNQ
    • RTY → M2K
    • YM → MYM

    This smaller contract size can make position sizing more flexible.

    What Are E-nano Futures?

    E-nano equity-index futures are another step down in contract size.

    CME says the E-nano multiplier is one-tenth the size of the corresponding Micro E-mini and one-hundredth the size of the E-mini.

    IndexE-miniMicro E-miniE-nano
    S&P 500$50 multiplier$5$0.50
    Nasdaq-100$20$2$0.20
    Russell 2000$50$5$0.50
    Dow Jones$5$0.50$0.05

    CME’s E-nano specifications currently include product codes NES, NNQ, N2K and NDOW.

    Why contract size matters

    Suppose the S&P 500 moves 10 index points.

    Ignoring fees and execution differences:

    • ES: 10 × $50 = $500
    • MES: 10 × $5 = $50
    • E-nano S&P 500: 10 × $0.50 = $5

    This illustrates why contract selection matters so much.

    The smaller contract is not automatically “safer.” It simply changes the dollar value of price movements.


    Best Futures for Beginners

    There is no universally easiest futures contract.

    For beginners, a useful selection framework is:

    • Understandable underlying market
    • Strong liquidity
    • Clear contract specifications
    • Manageable tick value
    • Contract size that fits the risk plan
    • Trading hours that match your schedule
    • A strategy that has been tested before using meaningful capital

    Micro and E-nano contracts can provide smaller notional exposure in some equity-index markets, but beginners still need to understand margin, leverage, expiration, settlement and position sizing.

    The CFTC describes futures trading as volatile and complex and warns that individuals can lose all of their money and, in some situations, more than the amount initially deposited.

    If you are comparing futures with crypto markets, you can also review OfferBin’s educational discussion of cryptocurrency investing before treating the two markets as interchangeable. OfferBin’s cryptocurrency investment guide


    Best Futures for Day Trading

    Day traders often prioritize liquidity, predictable execution, active trading sessions and enough movement to make their strategy viable.

    Markets commonly researched for day trading include:

    ES/MES

    Useful for broad U.S. equity exposure and active index trading.

    NQ/MNQ

    Often considered by traders who specifically want Nasdaq-100 exposure and larger intraday movement.

    CL/MCL

    Relevant for traders who specialize in energy markets and understand crude-oil catalysts.

    GC/MGC

    Useful for traders who follow precious metals and macroeconomic events.

    RTY/M2K

    Provides small-cap equity exposure and can behave differently from the major large-cap indexes.

    The important distinction is that best for day trading does not mean most volatile.

    A market can move rapidly but still be a poor fit if its movement is too large for your position size or strategy.


    Best Futures for Scalping

    Scalping places even greater emphasis on execution.

    Important factors include:

    • Bid-ask spread
    • Market depth
    • Volume
    • Short-term volatility
    • Commission costs
    • Slippage
    • Trading-session liquidity

    A contract with frequent price movement may look attractive, but if execution costs are high relative to the expected move, the strategy can become less efficient.

    This is why liquidity should be evaluated alongside volatility rather than separately.


    Best Futures for Momentum Trading

    Momentum traders generally look for markets where price can sustain directional movement.

    Potential markets to research include:

    • NQ/MNQ
    • ES/MES
    • CL/MCL
    • GC/MGC
    • RTY/M2K

    But momentum is a strategy, not a property that makes a contract universally superior.

    A trader should examine how the market behaves around the specific session, news calendar and strategy rules being used.


    Best Futures for Trend Following

    Trend-following strategies can be applied across several futures markets.

    Equity indexes, commodities, currencies and interest-rate futures can all produce trends at different times.

    The contract itself is only one part of the decision.

    A trend-following trader should also consider:

    • Time frame
    • Average price movement
    • Trading costs
    • Contract liquidity
    • Roll schedule
    • Position sizing
    • Maximum drawdown
    • Stop-loss distance

    How Much Money Do You Need to Trade Futures?

    There is no single dollar amount that works for everyone.

    That’s because margin is not the same thing as the amount of money you should risk.

    CFTC explains that futures margin is a performance bond rather than a conventional down payment, and that futures positions are marked to market.

    A broker may also impose requirements above exchange minimums.

    Contract value vs margin

    A futures contract can have a large notional value while requiring only a fraction of that amount as margin.

    That creates leverage.

    For example, an equity-index contract’s notional value can be calculated using:

    Futures price × contract multiplier = notional value

    CME uses this formula for equity-index futures.

    But the amount of margin required to hold a position is not the same as the amount you can afford to lose.

    A better question

    Instead of asking:

    “What is the minimum account size?”

    ask:

    “What contract size allows my planned stop distance and risk per trade to stay within my risk limits?”

    That is a much more useful risk-management question.


    Futures Tick Value Explained

    A tick is the minimum price fluctuation defined by the exchange.

    CME notes that tick sizes vary by futures contract. For example, the E-mini S&P 500 moves in 0.25-point increments, while each tick is worth $12.50 because of its $50 multiplier.

    A simple formula is:

    Dollar move = Number of ticks × Tick value × Number of contracts

    For example, if a contract has a $1 tick value and moves 20 ticks:

    20 × $1 = $20

    This simple calculation is essential before entering any futures position.


    How to Choose the Best Futures Contract

    Instead of choosing a contract because someone calls it “the best,” use this process.

    Start with your strategy

    Are you:

    • Day trading?
    • Scalping?
    • Swing trading?
    • Trend following?
    • Trading macroeconomic events?
    • Trading commodity-specific news?

    Your strategy should narrow the market choices.

    Check liquidity

    Look at:

    • Volume
    • Open interest
    • Bid-ask spread
    • Market depth
    • Typical session activity

    CME specifically identifies these as useful liquidity considerations.

    Check volatility

    Ask:

    • How much does the market normally move?
    • How quickly can it move?
    • Does the movement fit your stop?
    • Can your account handle the dollar impact?

    Check tick value

    Never enter a futures market without knowing how much each minimum price movement is worth.

    Check contract size

    Compare:

    • Standard
    • E-mini
    • Micro
    • E-nano where available

    Check trading hours

    A market can behave differently during:

    • U.S. open
    • European session
    • Asian session
    • Economic releases
    • Major market overlaps

    Check your risk per trade

    Your position size should be determined by your risk framework, not by the maximum number of contracts your broker allows.


    👉 ES vs NQ: Which Futures Market Should You Research?

    ES and NQ are both major equity-index futures, but they represent different benchmarks.

    ES

    Tracks the S&P 500 and provides broad large-cap U.S. equity exposure.

    NQ

    Tracks the Nasdaq-100 and provides exposure to a more technology- and growth-oriented index.

    The practical difference

    If your strategy is sensitive to volatility, the difference in price behavior matters more than the names of the indexes.

    Instead of asking:

    “Is ES better than NQ?”

    ask:

    “Which market’s typical movement and tick value fit my strategy and risk limits?”

    That question produces a more useful answer.


    ES vs MES

    The underlying benchmark is the same, but the contract multiplier is different.

    ES uses a $50 multiplier while MES uses $5.

    That means MES provides a smaller dollar exposure per index point.

    For traders who need finer position sizing, that difference can be significant.


    NQ vs MNQ

    The same principle applies.

    NQ uses a $20 multiplier, while MNQ uses $2.

    The choice is therefore not simply about which market is more popular.

    It’s about:

    • exposure
    • tick value
    • position size
    • risk per trade
    • strategy
    • execution

    Most Liquid Futures Contracts

    Liquidity changes over time and varies by contract month and trading session, so a static list of “the most liquid futures” should not be treated as permanent.

    Major contracts commonly associated with deep futures markets include:

    • S&P 500 futures
    • Nasdaq-100 futures
    • WTI crude oil
    • Gold
    • U.S. Treasury futures
    • Major currency futures

    CME’s liquidity framework emphasizes more than volume alone. Traders should also consider open interest, spreads and order-book depth.

    Before trading, check current market data rather than relying on an old liquidity ranking.


    Most Volatile Futures

    Volatility changes with market conditions.

    Potentially fast-moving markets can include:

    • Nasdaq-100 futures
    • Crude oil futures
    • Gold futures
    • Russell 2000 futures
    • Other commodity and equity-index contracts during major events

    But “most volatile” does not mean “best.”

    High volatility can produce larger opportunities and larger losses.

    For a trader with a small risk limit, a smaller contract in a highly active market may be more practical than a larger contract in the same market.


    Common Futures Trading Mistakes

    Choosing a contract because it is popular

    Popularity doesn’t automatically make a contract appropriate for your strategy.

    Confusing margin with affordable risk

    The margin requirement tells you what is required to maintain the position under applicable rules. It does not tell you what you should risk.

    Ignoring tick value

    A seemingly small price movement can translate into a meaningful dollar gain or loss.

    Trading excessive volatility

    Fast markets can punish oversized positions quickly.

    Ignoring liquidity

    A market may look attractive on a chart but behave differently when liquidity becomes thinner.

    Failing to check contract specifications

    Every futures contract has its own specifications, including contract size, tick size, expiration and settlement characteristics. CME emphasizes that these specifications directly affect trading decisions.

    Treating futures like stocks

    Futures are leveraged derivatives with contract specifications, expiration schedules and margin requirements.

    The CFTC advises traders to understand the specific obligations and risks before trading.


    Futures Trading Risk: What You Should Know

    Futures trading can create substantial losses because leverage magnifies the financial impact of price movements.

    The CFTC specifically warns that futures trading is volatile and complex and that losses can exceed the initial amount deposited in some circumstances.

    Before trading, understand:

    • Initial margin
    • Maintenance margin
    • Variation margin
    • Contract value
    • Tick value
    • Expiration
    • Settlement
    • Position size
    • Stop-loss risk
    • Slippage
    • Commissions and fees

    Never use emergency savings, money needed for living expenses or other funds you cannot afford to lose as trading capital. CFTC guidance emphasizes using only risk capital for speculative trading.


    Frequently Asked Questions

    What are the best futures to trade in 2026?

    Common futures markets to research in 2026 include ES/MES, NQ/MNQ, CL/MCL, GC/MGC, RTY/M2K, YM/MYM and ZN. The appropriate contract depends on liquidity, volatility, contract size, tick value, trading strategy and risk tolerance.

    What is the best futures contract to trade?

    There is no universal best futures contract. ES, NQ, crude oil, gold and Treasury futures serve different purposes and have different contract specifications and risk profiles.

    What are the most liquid futures contracts?

    Major equity indexes, crude oil, gold, Treasury and currency futures are among the major liquid futures markets. However, liquidity varies by contract, expiration month and trading session, so current volume, open interest, spread and market depth should be checked.

    What futures are best for day trading?

    ES/MES and NQ/MNQ are commonly researched for equity-index day trading. CL/MCL and GC/MGC may also suit traders who specialize in energy or metals. The right choice depends on strategy, execution conditions and risk limits.

    What are the best futures for beginners?

    Beginners should generally focus on understanding contract specifications, liquidity, tick value, margin and risk before selecting a market. Smaller contracts such as Micro and, where appropriate, E-nano contracts can provide smaller exposure, but they do not remove leverage risk.

    Are Micro futures good for beginners?

    Micro futures can make position sizing more flexible because their contract multipliers are smaller than corresponding E-mini contracts. However, they are still leveraged futures and require the same understanding of margin, expiration, execution and risk.

    What is the difference between ES and MES?

    Both track the S&P 500. ES has a $50 multiplier, while MES has a $5 multiplier, making MES one-tenth the size of ES by multiplier.

    What is the difference between NQ and MNQ?

    Both track the Nasdaq-100. NQ uses a $20 multiplier while MNQ uses a $2 multiplier.

    What futures have the most volatility?

    Volatility changes over time. Nasdaq-100, crude oil, gold and small-cap equity futures can experience substantial price movement, especially around major economic or market events. Higher volatility also increases potential risk.

    How much money do you need to trade futures?

    There is no universal amount. Exchange and broker margin requirements differ, and the appropriate account size depends on contract size, strategy and risk management. Margin should not be confused with the amount you can afford to lose.

    What makes a good futures contract?

    A useful futures contract for a particular trader may combine adequate liquidity, suitable volatility, manageable tick value, appropriate contract size, reliable execution and trading hours that fit the strategy.

    How does futures liquidity affect trading?

    Higher liquidity can support tighter spreads and deeper markets, but liquidity is not constant. Traders should consider volume, open interest, bid-ask spread and order-book depth rather than relying on one metric.

    How does volatility affect futures trading?

    Volatility determines how quickly and how far prices can move. Higher volatility can create more opportunity but also increases the potential dollar impact of a position, especially when leverage is involved.


    Final Takeaway

    The best futures to trade in 2026 are not necessarily the contracts with the biggest price movements or the most attention online.

    A better approach is to compare:

    Liquidity → Volatility → Contract Size → Tick Value → Trading Session → Strategy → Risk

    For equity-index traders, ES/MES and NQ/MNQ are important markets to understand. For commodities, CL/MCL and GC/MGC offer major energy and precious-metals exposure. RTY/M2K and YM/MYM provide alternative equity-index exposure, while ZN gives traders access to the U.S. Treasury market.

    The biggest 2026 development for smaller-sized equity-index exposure is the arrival of CME’s E-nano futures. These contracts are one-tenth the size of Micro E-minis, creating another contract-size option for the S&P 500, Nasdaq-100, Russell 2000 and Dow Jones benchmarks.

    The key is to choose the contract that fits your strategy and risk framework, rather than assuming one market is objectively best for everyone.

    For readers who also follow cryptocurrency markets, OfferBin provides live crypto market information and token-conversion tools alongside its educational resources. Explore OfferBin’s market resources

  • What Is Active Trading? Types, Strategies, Risks & Examples

    What Is Active Trading? Types, Strategies, Risks & Examples

    Active trading is an approach to buying and selling financial assets more frequently in an effort to respond to shorter-term market movements. Unlike passive investing, which often relies on holding investments for longer periods, active trading requires ongoing decisions about when to enter, manage, and exit positions.

    Active trading can involve stocks, ETFs, currencies, cryptocurrencies, and other financial instruments. The trading style can range from holding a position for seconds or minutes to keeping it open for weeks or months.

    The key point is simple: active trading is defined more by the level of ongoing decision-making and trading activity than by one specific holding period.

    Quick answer: Active trading means regularly buying and selling assets based on market conditions, analysis, or a predefined trading strategy. Common approaches include scalping, day trading, swing trading, momentum trading, and position trading. It can offer more opportunities to respond to price movements, but it also involves trading costs, market risk, and a greater time commitment.

    What Is Active Trading?

    Active trading is a strategy in which a trader frequently monitors markets and makes deliberate buying and selling decisions rather than simply purchasing an asset and holding it for the long term.

    An active trader may look for:

    • Short-term price movements
    • Market trends
    • Momentum
    • Changes in trading volume
    • Technical patterns
    • Fundamental developments
    • Potential entry and exit points
    • Changes in volatility

    The exact approach depends on the trader’s strategy and time horizon.

    For example, one trader might open and close positions within the same day, while another might hold positions for several weeks. Both can be considered active traders because their decisions involve ongoing analysis and management rather than a simple buy-and-hold approach.

    Active Trading Meaning in Simple Terms

    Think of investing as planting a tree and waiting for it to grow.

    Active trading is more like managing a garden every day. You monitor conditions, make adjustments, and decide when action may be appropriate.

    That doesn’t mean active trading automatically produces better results. It simply involves a more hands-on approach.

    Investor.gov describes active trading as regular, ongoing buying and selling of investments and highlights the additional costs and risks that can accompany frequent trading.

    How Does Active Trading Work?

    The basic process of active trading involves identifying a potential opportunity, deciding whether to enter a position, managing risk, and eventually closing the position.

    A simplified active trading process looks like this:

    1. Choose a market or asset
    2. Analyze market conditions
    3. Identify a potential setup
    4. Determine an entry point
    5. Set a position size
    6. Define acceptable risk
    7. Monitor the position
    8. Exit according to the trading plan
    9. Review the result

    The process sounds straightforward, but making consistent decisions under changing market conditions is considerably more difficult.

    An active trader may use technical analysis, fundamental analysis, market news, trading volume, or a combination of these approaches.

    Example of Active Trading

    Suppose a trader notices that an asset has been moving within a defined range.

    Rather than buying it and planning to hold for several years, the trader might monitor the price for a potential setup, establish an entry point, determine where the trade would be invalidated, and plan an exit.

    If market conditions change, the trader may close the position instead of continuing to hold it.

    This is active trading because the position is being managed according to changing market information.


    What Are the Main Types of Active Trading?

    Active trading isn’t one single strategy. It includes several styles that differ primarily in holding period, trading frequency, and decision-making process.

    Trading StyleTypical Holding PeriodGeneral Approach
    ScalpingSeconds to minutesAttempts to capture very small price movements
    Day tradingMinutes to hoursPositions generally opened and closed within the trading day
    Swing tradingDays to several weeksAttempts to capture larger short-term moves
    Momentum tradingVariesFocuses on assets showing strong price movement
    Position tradingWeeks to monthsAttempts to capture broader market trends

    These timeframes are general descriptions, not strict rules. A trader’s actual holding period can vary considerably.

    Scalping

    Scalping is a very short-term trading approach.

    Scalpers may enter and exit positions within minutes or even seconds, attempting to capture relatively small price changes.

    Because individual trades may target small movements, scalping can involve a high number of transactions. That makes execution quality, spreads, fees, liquidity, and discipline particularly important.

    The strategy also requires significant attention because market conditions can change quickly.

    Day Trading

    Day trading involves opening and closing trades within the same trading day in many cases.

    A day trader may analyze:

    • Price charts
    • Trading volume
    • Market news
    • Momentum
    • Technical indicators
    • Intraday support and resistance

    The objective is generally to respond to price movements that occur during the trading session rather than maintain the position for an extended period.

    Day trading can be particularly demanding because decisions may need to be made quickly.

    FINRA warns that day trading can involve substantial risks and that traders should understand the risks, costs, and requirements involved before participating.

    Swing Trading

    Swing trading generally involves holding positions for several days or weeks.

    Instead of trying to capture tiny intraday movements, a swing trader may attempt to participate in a larger move.

    For example, a trader might identify an emerging trend and establish a position after a potential pullback, then exit if the expected move develops or the trading setup becomes invalid.

    Swing trading generally requires less constant monitoring than scalping, but it still requires a defined trading plan and risk management.

    Momentum Trading

    Momentum trading focuses on assets experiencing strong directional price movement.

    A momentum trader may look for:

    • Strong price increases or decreases
    • Rising trading volume
    • Breakouts
    • News-driven movements
    • Market sentiment
    • Continuation patterns

    Momentum can disappear quickly, however. A strong move doesn’t guarantee that the movement will continue.

    Position Trading

    Position trading generally involves holding positions for weeks or months while attempting to benefit from a larger market trend.

    It sits toward the longer-term end of active trading.

    Position traders may combine fundamental analysis with technical analysis and pay attention to broader economic or industry developments.


    Active Trading vs Passive Investing

    The biggest difference between active trading and passive investing is the level and frequency of decision-making.

    FactorActive TradingPassive Investing
    Trading frequencyGenerally higherGenerally lower
    Holding periodOften shorterOften longer
    Market monitoringMore frequentUsually less frequent
    Decision-makingOngoingMore limited
    Trading costsCan be higherOften lower
    Time commitmentUsually higherUsually lower
    Main focusResponding to market opportunitiesLong-term exposure
    Portfolio changesMore frequentLess frequent

    Passive investing often emphasizes a long-term buy-and-hold approach, while active trading involves more frequent decisions about positions.

    Neither label tells you whether a particular investment will make or lose money.

    The important distinction is the approach, not an assumption that one approach will always outperform another.


    👉 Active Trading vs Active Investing

    Active trading and active investing sound similar, but they aren’t necessarily the same thing.

    👉Active investing generally involves selecting investments or adjusting a portfolio with the goal of outperforming a benchmark or achieving a particular investment objective.

    Active trading usually involves more frequent buying and selling and greater attention to shorter- or intermediate-term market movements.

    For example, an active investor might research companies and adjust a portfolio several times a year.

    An active trader could potentially enter and exit positions several times in a single day.

    The boundaries aren’t absolute, but trading frequency and holding period are useful ways to distinguish the approaches.


    How Do Active Traders Make Trading Decisions?

    Active traders can use different forms of analysis depending on their strategy.

    Technical Analysis

    Technical analysis examines price and market data to identify patterns, trends, momentum, support and resistance, and other potential signals.

    Common information includes:

    • Price history
    • Trading volume
    • Moving averages
    • Trend lines
    • Chart patterns
    • Momentum indicators
    • Volatility

    Technical analysis doesn’t predict the future with certainty. It provides a framework for interpreting market behavior.

    Fundamental Analysis

    Fundamental analysis focuses on information about an asset or the underlying business or economic environment.

    For stocks, this can include:

    • Revenue
    • Earnings
    • Valuation
    • Debt
    • Industry conditions
    • Economic developments

    For crypto assets, the relevant factors can be different and may include network activity, token supply, adoption, ecosystem developments, market liquidity, and broader market conditions.

    Trading Volume

    Trading volume measures how much of an asset changes hands during a particular period.

    Traders often monitor volume alongside price because unusually high or low volume can provide additional context about market activity.

    However, volume alone doesn’t determine whether a price will rise or fall.

    Market Trends

    An active trader may classify a market as:

    • Uptrending
    • Downtrending
    • Range-bound
    • Highly volatile

    Understanding the broader market environment can help determine whether a particular strategy is appropriate for the conditions being observed.


    What Are Common Active Trading Strategies?

    There is no universal active trading strategy that works in every market.

    Some commonly discussed approaches include:

    Trend Trading

    Trend traders attempt to participate in an established directional movement.

    The trader may look for evidence that the trend is continuing before entering a position.

    Breakout Trading

    Breakout traders watch for price moving beyond an important range or level.

    The challenge is distinguishing a genuine breakout from a temporary move that quickly reverses.

    Mean Reversion

    Mean-reversion approaches are based on the idea that prices may move back toward an observed average or range after becoming unusually extended.

    This approach can behave very differently depending on market conditions.

    Momentum Trading

    Momentum strategies focus on strong directional movements and attempt to participate while momentum remains favorable.

    News-Based Trading

    Some traders respond to events such as:

    • Economic announcements
    • Company earnings
    • Regulatory developments
    • Major industry news
    • Crypto ecosystem announcements

    News-driven markets can move rapidly, increasing both opportunity and risk.


    What Are the Risks of Active Trading?

    Active trading carries significant risks, and trading more frequently doesn’t automatically create better results.

    Market Risk

    Prices can move against a position.

    Even a carefully researched trade can produce a loss.

    Trading Costs

    Frequent trading can increase the impact of:

    • Brokerage fees
    • Exchange fees
    • Bid-ask spreads
    • Slippage
    • Taxes, depending on jurisdiction

    A strategy that appears profitable before costs may produce a very different result after costs.

    Market Volatility

    Volatility can create larger price movements in either direction.

    This can create opportunities for traders, but it can also increase losses.

    Crypto markets can be particularly volatile, so anyone researching active trading in crypto should understand that rapid price changes can occur.

    Emotional Trading

    Fear, greed, frustration, and overconfidence can influence decision-making.

    For example, a trader who experiences a loss might increase position size simply to try to recover the money quickly.

    That’s an emotional response rather than a disciplined trading process.

    Overtrading

    Overtrading occurs when a trader takes more positions than their strategy or market conditions justify.

    More trades do not automatically mean more opportunities.

    Sometimes, the best trading decision is to wait.

    Leverage Risk

    Leverage can increase exposure to market movements and can magnify losses as well as gains.

    It therefore introduces an additional layer of risk that traders need to understand before using it.


    Why Is Risk Management Important in Active Trading?

    Risk management is one of the most important parts of an active trading approach.

    A trading plan can define:

    • Maximum acceptable loss
    • Position size
    • Entry conditions
    • Exit conditions
    • Stop-loss levels
    • Profit-taking rules
    • Maximum number of trades
    • Conditions for staying out of the market

    A stop-loss can be used to automatically or manually exit a position when a predetermined price level is reached, depending on the market and order type.

    A take-profit instruction can similarly be used to exit when a specified target is reached.

    Neither eliminates risk.

    A price can move rapidly, execution conditions can vary, and an order may not always execute at the exact price a trader expects.


    Is Active Trading Profitable?

    Active trading can be profitable for some traders, but profitability is not guaranteed.

    Results can depend on numerous factors, including:

    • Strategy
    • Market conditions
    • Trading costs
    • Risk management
    • Execution
    • Position sizing
    • Discipline
    • Experience
    • Taxes
    • Individual circumstances

    Frequent trading also creates more opportunities to make mistakes.

    Investor.gov notes that research has found frequent trading can hurt investment performance for many individual investors.

    Therefore, the number of trades should not be treated as a measure of success.

    A better way to evaluate a trading approach is to consider its rules, costs, risk exposure, consistency, and performance over an appropriate period.


    Is Active Trading Good for Beginners?

    Active trading can be learned by beginners, but beginners should understand that learning the terminology is very different from becoming consistently successful.

    Before placing real trades, a beginner should understand:

    • How markets work
    • Order types
    • Bid-ask spreads
    • Trading fees
    • Position sizing
    • Risk management
    • Volatility
    • Basic technical and fundamental analysis
    • Trading psychology

    A written trading plan can also help prevent impulsive decisions.

    Beginners should be particularly cautious about using borrowed money or leverage because losses can become larger and more difficult to manage.


    How Much Money Do You Need for Active Trading?

    There isn’t one universal amount of money required to start active trading.

    The amount can depend on:

    • Asset being traded
    • Broker or exchange requirements
    • Account type
    • Trading strategy
    • Position size
    • Regulatory requirements
    • Transaction costs
    • Personal risk tolerance

    Regulatory rules can also change over time and differ by market and jurisdiction.

    For example, U.S. securities day-trading requirements have changed in 2026, so older articles quoting historical requirements shouldn’t automatically be treated as current rules. FINRA announced new intraday margin requirements effective June 4, 2026, with a transition period for firms.

    The more useful question isn’t simply “How much money do I need?”

    It’s:

    “How much capital can I afford to expose to trading risk without putting essential finances at risk?”

    That question is personal and depends on circumstances that a general article cannot determine for you.


    How Does Active Trading Apply to Crypto?

    Active trading can also be applied to cryptocurrency markets.

    Crypto traders may monitor:

    • Bitcoin and other token prices
    • Market trends
    • Trading volume
    • Volatility
    • Market sentiment
    • Liquidity
    • News and ecosystem developments

    Crypto markets can operate continuously, unlike traditional stock markets that generally have defined trading sessions.

    That can create a different trading environment because price movements can occur at any time.

    For readers researching crypto market movements, OfferBin provides live cryptocurrency prices and token conversion tools for reference. You can use OfferBin to monitor supported crypto prices and explore market information.

    For example, OfferBin’s existing analysis of Bitcoin price movements explores factors that can influence Bitcoin’s price behavior and market volatility.

    Important distinction

    OfferBin is a price-tracking and token-conversion resource, not a broker or exchange for executing trades.

    That distinction matters. Checking a live price or converting one token value into another is different from placing an order in the market.


    What Tools Do Active Traders Use?

    Depending on the market and strategy, active traders may use:

    • Price charts
    • Market-data platforms
    • Trading-volume information
    • Technical indicators
    • Economic calendars
    • News feeds
    • Market screeners
    • Trading journals
    • Risk calculators
    • Order-management tools

    The right tools depend on the strategy.

    A scalper may need very different tools from a position trader.

    For crypto specifically, traders may also need reliable access to current token prices and market information.


    Common Active Trading Mistakes

    Trading Without a Plan

    Entering a position simply because the price is moving can lead to inconsistent decisions.

    Chasing Price

    Buying after a sharp move because of fear of missing out can create poor entry conditions.

    Ignoring Costs

    Fees and spreads can accumulate quickly when trading frequently.

    Taking Excessive Risk

    A single position shouldn’t expose an account to an amount of risk that the trader cannot reasonably absorb.

    Moving a Stop Because of Emotion

    Changing predefined risk limits simply because a trade is losing can turn a controlled loss into a much larger one.

    Revenge Trading

    Trying to immediately recover a loss through additional trades can create a cycle of emotional decisions.

    Constantly Changing Strategies

    A strategy needs enough consistent application to determine whether its process is working. Changing the rules after every losing trade makes evaluation difficult.


    Active Trading: A Simple Framework for Beginners

    If you’re studying active trading, a structured learning process can be more useful than jumping between strategies.

    Start with market mechanics

    Learn how orders, prices, spreads, liquidity, and execution work.

    Choose one trading style

    Understand the difference between scalping, day trading, swing trading, and position trading.

    Learn risk management

    Understand position sizing, stop-losses, risk-reward ratios, and portfolio exposure.

    Develop a written plan

    Define when you will consider entering, when you’ll exit, and what conditions invalidate the setup.

    Practice before increasing risk

    Use educational exercises or simulated environments where appropriate before committing significant capital.

    Review your decisions

    Keep a trading journal that records the reason for each trade, the outcome, and whether you followed your plan.

    The objective should be to build a repeatable decision-making process rather than chase individual winning trades.


    Active Trading vs Long-Term Investing: Which Approach Fits?

    The answer depends on the individual’s objectives, time commitment, risk tolerance, knowledge, and financial circumstances.

    If you prefer…You may be more interested in…
    Frequent market decisionsActive trading
    Monitoring short-term movementsActive trading
    Fewer transactionsPassive investing
    Long holding periodsLong-term investing
    A hands-on processActive trading
    A lower-maintenance approachPassive investing

    This isn’t a recommendation that one approach is better.

    It’s simply a way to understand the practical differences between the approaches.


    Frequently Asked Questions About Active Trading

    What is active trading in simple terms?

    Active trading means regularly buying and selling financial assets while monitoring market conditions and making ongoing decisions about positions. It can involve different holding periods, from very short-term trades to positions lasting weeks or months.

    What does an active trader do?

    An active trader analyzes markets, looks for potential trading setups, enters and manages positions, controls risk, and decides when to exit. The exact process depends on the trader’s strategy and market.

    Is active trading the same as day trading?

    No. Day trading is one type of active trading. Active trading is a broader category that can include scalping, day trading, swing trading, momentum trading, and position trading.

    What are the main active trading strategies?

    Common approaches include trend trading, breakout trading, momentum trading, mean reversion, and news-based trading. Traders may also combine multiple methods.

    Is active trading profitable?

    It can be profitable for some participants, but profitability is not guaranteed. Trading costs, market conditions, risk management, execution, strategy, and discipline can all affect results.

    Is active trading good for beginners?

    Beginners can learn active trading, but it involves substantial risks and requires an understanding of market mechanics, costs, risk management, and trading psychology. Starting with education and limited risk is generally more appropriate than immediately taking large positions.

    How often do active traders trade?

    Trading frequency varies widely. A scalper may make many trades in a session, while a swing or position trader may only make a few trades over a longer period.

    What is active trading vs passive investing?

    Active trading involves more frequent market decisions and usually more trading activity. Passive investing generally emphasizes long-term exposure and fewer transactions.

    Can active trading be used for crypto?

    Yes. Crypto markets can be traded using active approaches such as day trading, swing trading, momentum trading, and other methods. However, crypto prices can be highly volatile, and market conditions can change rapidly.

    What is the biggest risk of active trading?

    There isn’t one single risk. Market losses, excessive trading, leverage, transaction costs, emotional decisions, and poor risk management can all contribute to significant losses.


    Final Takeaway

    Active trading is a hands-on approach to the financial markets that involves making ongoing decisions about buying, managing, and selling positions. It includes several styles, from scalping and day trading to swing and position trading.

    The biggest difference between active trading and passive investing is the level of involvement and trading frequency. Active trading can provide more opportunities to respond to market movements, but it also introduces additional costs, decisions, and risks.

    For anyone exploring active trading, understanding market mechanics, strategy, risk management, trading costs, and psychology is more important than simply learning when to buy or sell.

    If your interest is specifically in crypto markets, you can also explore OfferBin’s crypto market resources for current token prices and related educational information.

  • Student Loan Plans UK: Plan 1, 2, 4, 5 & Postgraduate Explained

    Student Loan Plans UK: Plan 1, 2, 4, 5 & Postgraduate Explained

    If you have a UK student loan, the amount you repay depends mainly on which student loan plan you have and how much you earn.

    For the 2026/27 tax year, there are five main undergraduate repayment plans — Plan 1, Plan 2, Plan 4 and Plan 5 — plus the separate Postgraduate Loan repayment plan. Plans have different income thresholds, interest rules and write-off periods.

    The most important point is that your student loan balance does not determine how much you repay each year. Repayments are based on your income above the threshold for your plan.

    Student Loan Plans at a Glance

    Here are the main repayment thresholds and rates for 2026/27:

    Student loan plan2026/27 annual thresholdMonthly thresholdRepayment rate
    Plan 1£26,900£2,2419%
    Plan 2£29,385£2,4489%
    Plan 4£33,795£2,8169%
    Plan 5£25,000£2,0839%
    Postgraduate Loan£21,000£1,7506%

    These are the official 2026/27 thresholds. Your repayment is calculated on the portion of income above the relevant threshold, not on your entire salary.

    For example, if you are on Plan 2 and earn £40,000:

    • Annual income: £40,000
    • Plan 2 threshold: £29,385
    • Income above threshold: £10,615
    • Repayment: 9% × £10,615
    • Annual repayment: £955.35
    • Average monthly equivalent: about £79.61

    Your actual deductions can vary depending on how you are paid and how payroll calculations are applied.

    What Are Student Loan Plans?

    Student loan plans are different sets of repayment rules that determine when you repay your loan, how much you repay and how interest is applied.

    Your plan is generally determined by factors such as:

    • Where you studied
    • When you started your course
    • Whether the loan was undergraduate or postgraduate
    • Which UK student-finance system provided the loan

    The main UK income-contingent plans are:

    • Plan 1
    • Plan 2
    • Plan 4
    • Plan 5
    • Postgraduate Loan

    Plan 1 generally covers older loans, including borrowers who started certain courses before September 2012 and borrowers in Northern Ireland. .Plan 4 applies to eligible Scottish borrowers. Plan 2 covers many English and Welsh undergraduate borrowers who started under the previous system, while Plan 5 applies to new English undergraduate borrowers from August 2023.

    👉Plan 1 Student Loans

    Plan 1 applies mainly to borrowers who started eligible undergraduate courses before September 2012. It also covers certain borrowers in Northern Ireland.

    For 2026/27:

    • Threshold: £26,900 a year
    • Monthly threshold: about £2,241
    • Repayment rate: 9% above the threshold
    • Current interest rate: 4.1%

    The Plan 1 interest rate is subject to the applicable rules and can be linked to RPI or the Bank of England base rate plus 1%, whichever is lower under the relevant rules. For 1 September 2026 to 31 August 2027, the maximum applicable Plan 1 rate is 4.1%.

    How Plan 1 repayment works

    Suppose you earn £33,000 a year.

    Your income above the annual threshold is:

    £33,000 − £26,900 = £6,100

    You repay 9% of that amount:

    £6,100 × 9% = £549 a year

    That is approximately £45.75 a month when expressed as an annual average.

    Plan 2 Student Loans

    Plan 2 is commonly associated with English undergraduate courses that started between September 2012 and July 2023 and Welsh undergraduate borrowers who started from September 2012.

    For 2026/27:

    • Threshold: £29,385 a year
    • Monthly threshold: about £2,448
    • Repayment rate: 9% above the threshold
    • Interest can vary according to income
    • Current Plan 2 interest is subject to a 6% cap for the 2026/27 period

    GOV.UK states that after study, Plan 2 interest is normally RPI plus up to 3%, depending on income, with the current 6% cap applying during the relevant 2026/27 period.

    Plan 2 repayment example

    Imagine your annual salary is £50,000.

    Income above the threshold:

    £50,000 − £29,385 = £20,615

    Repayment:

    £20,615 × 9% = £1,855.35 a year

    That is approximately £154.61 per month when divided by 12.

    Notice that the calculation is based on the £20,615 above the threshold, not the full £50,000 salary.

    Plan 4 Student Loans

    Plan 4 applies primarily to eligible Scottish student-loan borrowers.

    For 2026/27:

    • Threshold: £33,795 a year
    • Monthly threshold: about £2,816
    • Repayment rate: 9% above the threshold
    • Current interest rate: 4.1%

    Plan 4 example

    If you earn £36,000:

    £36,000 − £33,795 = £2,205

    Your annual repayment is:

    £2,205 × 9% = £198.45

    That works out at about £16.54 per month on an annual-average basis.

    Plan 5 Student Loans

    Plan 5 is the newer undergraduate repayment plan for eligible English students who started courses from August 2023.

    For 2026/27:

    • Threshold: £25,000 a year
    • Monthly threshold: about £2,083
    • Repayment rate: 9%
    • Interest is normally linked to RPI
    • Repayment term: 40 years

    The government introduced Plan 5 for new English undergraduate borrowers from the 2023/24 academic year.

    Plan 5 example

    If you earn £30,000:

    £30,000 − £25,000 = £5,000

    Your annual repayment would be:

    £5,000 × 9% = £450

    That is approximately £37.50 per month on an annual-average basis.

    Postgraduate Loan Repayment Plan

    A Postgraduate Loan is separate from the undergraduate plans.

    For 2026/27:

    • Threshold: £21,000 a year
    • Monthly threshold: £1,750
    • Repayment rate: 6%
    • Write-off period for eligible England and Wales postgraduate loans: 30 years

    Interest is normally RPI plus 3%, with a 6% cap applying between 1 September 2026 and 31 August 2027.

    Postgraduate Loan example

    Suppose you earn £30,000.

    Income above the £21,000 threshold:

    £30,000 − £21,000 = £9,000

    Repayment:

    £9,000 × 6% = £540 a year

    That is equivalent to approximately £45 per month.

    Which Student Loan Plan Am I On?

    If you are unsure which plan you have, do not guess based only on your current salary.

    Your plan can depend on your:

    1. Country or region of study
    2. Course start date
    3. Type of course
    4. Type of student finance
    5. Previous loans

    A useful starting point is your Student Loans Company information and your payroll records.

    Your employer’s payroll process can also use your student-loan plan information when calculating deductions. HMRC’s 2026/27 payroll guidance specifically lists Plan 1, Plan 2, Plan 4, Plan 5 and Postgraduate Loans.

    If you have paperwork that uses different terminology, look for the plan type rather than assuming that every student loan follows the same repayment rules.

    How Do Student Loan Repayments Work?

    The basic calculation is straightforward:

    Repayment = (Income − Plan Threshold) × Repayment Rate

    But only apply the formula when your income is above the applicable threshold.

    For example, a Plan 2 borrower earning £40,000 in 2026/27 would have:

    £40,000 − £29,385 = £10,615

    Then:

    £10,615 × 9% = £955.35

    So the annual repayment is approximately £955.35.

    Your outstanding student loan balance does not change that annual repayment calculation. The balance and interest affect how long the loan may remain outstanding, but the repayment amount is primarily linked to income.

    What Happens If Your Income Changes?

    Student loan repayments are income-contingent, so your deductions can change when your earnings change.

    Income can include things such as:

    • Salary
    • Bonuses
    • Overtime
    • Other earnings included under the applicable repayment rules

    If your income temporarily rises above the threshold, you may make repayments during that period.

    GOV.UK also explains that if your annual income ends up below your plan’s annual threshold, you may be able to request a refund of certain repayments made during the year.

    Student Loan Interest Rates in 2026/27

    Interest is separate from your repayment calculation.

    This distinction is important:

    Your repayment is based on income.

    Interest affects your outstanding balance.

    For 2026/27, GOV.UK lists:

    PlanCurrent 2026/27 interest position
    Plan 14.1% maximum applicable rate for 1 Sept 2026–31 Aug 2027
    Plan 2Variable according to income, with a 6% cap during the relevant 2026/27 period
    Plan 44.1%
    Plan 5Normally RPI
    Postgraduate LoanNormally RPI + 3%, with a 6% cap during the relevant 2026/27 period

    Interest can continue to be applied even when you are below the repayment threshold. This is why the amount shown on your student-loan statement can behave differently from the amount being deducted from your payslip.

    When Are Student Loans Written Off?

    A student loan is not necessarily repaid like a conventional personal loan.

    If you do not repay the full balance within the applicable repayment period, the remaining amount can be cancelled under the rules for your plan.

    The timing depends on your plan and circumstances.

    PlanGeneral cancellation period
    Older Plan 1 loansDepends on when the loan was taken out; some older loans have age-based rules
    Plan 1 loans taken out from Sept 2006 to before Sept 201225 years after the April when repayments were first due
    Plan 230 years after the April when repayments were first due
    Plan 540 years after the April when repayments were first due
    Postgraduate Loan30 years after the April when repayments were first due

    The exact cancellation rules can depend on the type and date of the loan, so use your official loan information rather than assuming a single write-off period applies to everyone.

    Plan 1 vs Plan 2 vs Plan 4 vs Plan 5

    The biggest differences are the threshold, repayment rate, interest rules and repayment term.

    FeaturePlan 1Plan 2Plan 4Plan 5
    2026/27 threshold£26,900£29,385£33,795£25,000
    Repayment rate9%9%9%9%
    Main associationOlder UK loansMany 2012–2023 English/Welsh borrowersScottish borrowersNewer English undergraduate borrowers
    Interest4.1% current rateVariable, capped at 6% currently4.1%Normally RPI
    General repayment termDepends on loan date30 yearsDepends on loan date/rules40 years

    The table is a simplified overview. Your exact eligibility and terms depend on the loan you actually took out.

    What If You Have More Than One Student Loan?

    Some borrowers have more than one type of student loan.

    For example, you may have an undergraduate loan and a separate Postgraduate Loan.

    In that situation, deductions can apply under the rules for both loan types.

    For 2026/27, undergraduate Plan 1, 2, 4 and 5 repayments use a 9% rate above the relevant threshold, while the Postgraduate Loan uses a 6% rate above its threshold.

    GOV.UK provides specific rules for borrowers with multiple plan types, including how repayments are allocated when someone has more than one undergraduate plan.

    This is one reason a simple “student loan percentage” does not always tell the whole story.

    How Much Will You Repay on Different Salaries?

    Here are simplified annual examples for 2026/27.

    Annual incomePlan 1Plan 2Plan 4Plan 5Postgraduate Loan
    £25,000£0£0£0£0£240
    £30,000£279£55£0£450£540
    £40,000£1,179£955£559£1,350£1,140
    £50,000£2,079£1,855£1,459£2,250£1,740

    These examples use the annual thresholds and repayment percentages published for 2026/27. Actual payroll deductions can differ slightly because PAYE uses pay-period thresholds and payroll calculations.

    Do Student Loans Affect Your Credit Score?

    Student loan repayments are not treated like ordinary commercial borrowing for UK credit reporting.

    GOV.UK states that student loans do not appear on credit reports and do not affect your credit score. However, lenders may consider your student-loan repayment when assessing affordability for other borrowing, such as a mortgage.

    So a student loan can matter to your disposable income and affordability assessment even though it is not reported in the same way as a conventional credit balance.

    Can You Pay Off a Student Loan Early?

    Yes. GOV.UK states that there is no penalty for making voluntary early repayments.

    Whether making additional payments is appropriate depends on your circumstances, including:

    • Your plan
    • Your income
    • Your outstanding balance
    • Expected future earnings
    • Interest rates
    • How long you expect to remain in repayment
    • Your other financial priorities

    Because these factors vary substantially between borrowers, there is no single repayment strategy that applies to everyone.

    Student Loan Plans for People Living Overseas

    Moving outside the UK does not automatically remove your repayment obligations.

    The Student Loans Company publishes country-specific overseas earnings thresholds and repayment information. These can differ from the UK thresholds.

    For example, GOV.UK publishes separate 2026/27 overseas thresholds for Plan 1, Plan 2, Plan 5 and Postgraduate Loans.

    If you live abroad, check the official SLC information for the country where you live rather than applying the UK PAYE threshold directly.

    Common Student Loan Plan Questions

    What is the student loan threshold for 2026/27?

    For 2026/27, the annual thresholds are £26,900 for Plan 1, £29,385 for Plan 2, £33,795 for Plan 4, £25,000 for Plan 5 and £21,000 for Postgraduate Loans.

    What percentage do I repay?

    Plans 1, 2, 4 and 5 use a 9% repayment rate on income above the relevant threshold. Postgraduate Loans use 6%.

    Is Plan 5 the same as Plan 2?

    No. Plan 5 has a lower 2026/27 repayment threshold of £25,000 compared with £29,385 for Plan 2. Plan 5 also has a 40-year repayment term and normally applies RPI-only interest, while Plan 2 has different interest rules and a 30-year repayment period.

    What student loan plan am I on?

    Your plan normally depends on where and when you studied and the type of loan you received. Your Student Loans Company information and repayment records are the safest places to confirm your plan.

    Do I repay my student loan if I earn below the threshold?

    Normally, you do not make income-based repayments when your earnings are below the applicable threshold. However, interest can still be applied to your outstanding balance.

    Does my student loan balance determine my monthly payment?

    No. For income-contingent repayments, the amount you owe does not determine the amount you repay each year. Your income and repayment-plan threshold are the key factors.

    When does a student loan get written off?

    The period depends on the plan. Plan 2 loans generally have a 30-year cancellation period, Plan 5 has a 40-year period, and Postgraduate Loans in England and Wales generally have a 30-year period. Some older Plan 1 loans have different rules.

    Can I have an undergraduate loan and a Postgraduate Loan?

    Yes. A borrower can have an undergraduate student loan and a separate Postgraduate Loan, with repayments calculated under the relevant rules for each type.

    Key Takeaways

    Student loan plans can look complicated because the rules depend on when and where you studied, but the basic repayment system is relatively simple.

    For 2026/27:

    • Plan 1: £26,900 threshold and 9% repayment
    • Plan 2: £29,385 threshold and 9% repayment
    • Plan 4: £33,795 threshold and 9% repayment
    • Plan 5: £25,000 threshold and 9% repayment
    • Postgraduate Loan: £21,000 threshold and 6% repayment

    The amount you owe is not what determines your annual income-based repayment. Instead, you generally repay a percentage of income above your plan’s threshold.

    Because thresholds, interest rates and repayment rules can change, check the latest official information before making decisions about your student loan.

    For additional online guides and resources, you can also explore Offerbin.io.

    Official Sources

  • How to Identify Uptrends & Downtrends: HH, HL, LH & LL

    How to Identify Uptrends & Downtrends: HH, HL, LH & LL

    Knowing how to identify uptrends and downtrends is one of the most useful skills in technical analysis. Instead of trying to predict every price move, you can study the sequence of swing highs and swing lows to understand the market’s current direction.

    The basic framework is simple:

    • Uptrend: Higher highs (HH) and higher lows (HL)
    • Downtrend: Lower highs (LH) and lower lows (LL)
    • Sideways market: Price moves within a relatively defined range without a consistent sequence of higher or lower swings

    Fidelity and Charles Schwab use the same basic market-structure framework when explaining trend identification.

    For crypto traders and market observers, this framework can make price charts much easier to read. You can also use OfferBin’s live market data to check current crypto prices and compare price movements while studying market structure.

    How Do You Identify an Uptrend or Downtrend?

    You can identify an uptrend or downtrend by comparing important swing points on a price chart.

    An uptrend develops when price consistently forms higher highs and higher lows. Each major high is above the previous high, while each important pullback low remains above the previous low.

    A downtrend develops when price consistently forms lower highs and lower lows. Each rally fails below the previous high, while each major decline creates a new low.

    If neither pattern is clearly present, the market may be consolidating or moving sideways rather than trending.

    Market StructureHighsLowsTypical Direction
    UptrendHigher highsHigher lowsBullish
    DowntrendLower highsLower lowsBearish
    SidewaysSimilar/mixed highsSimilar/mixed lowsRange
    TransitionStructure becomes mixedStructure becomes mixedPossible reversal

    The important point is that one price move does not define a complete trend. Trend identification works better when you examine a sequence of meaningful swing points.

    What Is an Uptrend?

    An uptrend is a market structure in which price generally moves upward through a series of higher highs and higher lows.

    Imagine a market that moves like this:

    100 → 110 → 105 → 118 → 112 → 125

    The highs are:

    110 → 118 → 125

    Each high is higher than the previous one.

    The pullback lows are:

    105 → 112

    Each low is also higher than the previous one.

    That combination creates the classic higher-high, higher-low structure associated with an uptrend. Fidelity defines an uptrend as ascending peaks and troughs, specifically higher highs and higher lows.

    What Is a Higher High?

    A higher high (HH) occurs when price rises above a previous significant swing high.

    For example:

    • Previous swing high: $100
    • New swing high: $108

    Because $108 is above $100, the new point is a higher high.

    A series of higher highs suggests that buyers are able to push price beyond previous peaks.

    However, a higher high by itself does not automatically prove that a sustained uptrend exists. You also want to examine the lows between those highs.

    What Is a Higher Low?

    A higher low (HL) occurs when price pulls back but stops above a previous significant low.

    For example:

    • Previous swing low: $90
    • New swing low: $96

    Because $96 is above $90, the new low is a higher low.

    When higher highs and higher lows repeatedly appear together, the chart develops a rising structure.

    How Higher Highs and Higher Lows Create an Uptrend

    Think of an uptrend as a staircase.

    Price moves upward.

    Then it pulls back.

    But the pullback stops above the previous low.

    Price rises again and breaks the previous high.

    Then another pullback occurs.

    If the pattern continues, the market creates:

    HH → HL → HH → HL → HH

    That is the basic structure of an uptrend.


    What Is a Downtrend?

    A downtrend is the opposite structure.

    Price creates lower highs and lower lows as the market moves downward.

    For example:

    100 → 92 → 96 → 85 → 90 → 78

    The highs become:

    96 → 90

    Each is lower than the previous high.

    The lows become:

    92 → 85 → 78

    Each is lower than the previous low.

    That creates a descending market structure.

    Charles Schwab similarly describes downtrends as sequences of lower highs and lower lows.

    What Is a Lower High?

    A lower high (LH) forms when a rally fails below the previous significant high.

    For example:

    • Previous swing high: $100
    • New swing high: $94

    Because $94 is below $100, it is a lower high.

    Repeated lower highs indicate that rallies are losing ground compared with previous rallies.

    What Is a Lower Low?

    A lower low (LL) forms when price falls below a previous significant low.

    For example:

    • Previous swing low: $90
    • New swing low: $82

    Because $82 is below $90, the new point is a lower low.

    Repeated lower lows show that sellers are pushing price beneath previous lows.

    How Lower Highs and Lower Lows Create a Downtrend

    A typical downtrend can look like:

    LH → LL → LH → LL → LH → LL

    Price rallies but fails below the previous high.

    Then it falls below the previous low.

    The pattern repeats.

    This creates a descending staircase.


    Higher Highs and Higher Lows vs Lower Highs and Lower Lows

    The easiest way to remember the difference is to compare the structure rather than trying to memorize complicated definitions.

    TermMeaningMarket Structure
    Higher High (HH)New swing high above the previous highSupports bullish structure
    Higher Low (HL)New swing low above the previous lowSupports bullish structure
    Lower High (LH)New swing high below the previous highSupports bearish structure
    Lower Low (LL)New swing low below the previous lowSupports bearish structure

    The simple rule is:

    HH + HL = Uptrend

    LH + LL = Downtrend

    This framework is also used in crypto-chart education. Fidelity’s crypto chart guide describes an uptrend using higher highs and higher lows, a downtrend using lower highs and lower lows, and sideways price movement as consolidation.


    How to Identify an Uptrend on a Chart

    You do not need to inspect every single candle to identify a market trend. Start by looking for meaningful swing points.

    Mark the Major Swing Highs

    First, identify areas where price moved upward and then turned lower.

    These turning points can act as swing highs.

    Do not treat every tiny candle wick as a major swing high. The significance of a swing depends partly on the timeframe and surrounding price action.

    For more systematic chart analysis, technical tools can also define pivot highs and lows using surrounding bars. Fidelity, for example, describes pivot highs as highs surrounded by lower highs and pivot lows as lows surrounded by higher lows.

    Mark the Swing Lows

    Next, identify meaningful points where price declined and then began moving higher.

    These are swing lows.

    You now have two sets of information:

    • Swing highs
    • Swing lows

    The next step is to compare them.

    Compare Each High With the Previous High

    Ask:

    Is the new swing high above the previous swing high?

    If yes, you may have a higher high.

    If this happens repeatedly, bullish structure becomes more apparent.

    Compare Each Low With the Previous Low

    Now ask:

    Is the new swing low above the previous swing low?

    If yes, you may have a higher low.

    When higher highs and higher lows appear as a sequence, the evidence for an uptrend becomes stronger.

    Confirm the Sequence

    Do not label a market an uptrend simply because price increased for a few candles.

    Look for a recognizable sequence such as:

    HH → HL → HH → HL

    The more clearly this structure persists, the easier it becomes to describe the market as trending upward.


    How to Identify a Downtrend on a Chart

    The process is almost identical, but the structure is reversed.

    Identify Swing Highs

    Find the points where rallies ended and price began falling.

    Then compare each swing high with the previous one.

    Identify Swing Lows

    Find the points where declines ended and price began recovering.

    Then compare each low with the previous low.

    Look for Lower Highs

    If a rally ends below the previous significant high, the new point can be classified as a lower high.

    Look for Lower Lows

    If price subsequently falls below the previous significant low, the new point can be classified as a lower low.

    Confirm the Sequence

    A clearer downtrend structure looks like:

    LH → LL → LH → LL

    When this sequence persists, bearish market structure becomes more evident.


    What Are Swing Highs and Swing Lows?

    Swing highs and swing lows are important because they provide the reference points needed to identify market structure.

    A swing high is a meaningful local peak where price turns lower.

    A swing low is a meaningful local trough where price turns higher.

    The exact definition can vary depending on the timeframe and method being used.

    For example, a short-term trader might care about relatively small swings on a 15-minute chart, while someone studying a longer-term market structure may focus on weekly or monthly swings.

    This is why two people can look at the same asset and describe different short-term and long-term trends.

    Fidelity notes that trends can exist across primary, secondary, and minor time horizons, with shorter trends influencing movements within longer trends.


    Uptrend vs Downtrend vs Sideways Market

    Not every chart is trending.

    Sometimes price moves back and forth inside a range.

    This is commonly called a sideways market or consolidation.

    FeatureUptrendDowntrendSideways Market
    HighsHigherLowerOften similar/mixed
    LowsHigherLowerOften similar/mixed
    DirectionUpDownHorizontal
    StructureHH + HLLH + LLNo consistent sequence
    Market behaviorRisingFallingRange-bound

    Fidelity describes sideways markets as periods in which price moves horizontally within a range.

    Why This Matters

    A common mistake is assuming that every market must be either bullish or bearish.

    It does not.

    If price repeatedly moves between support and resistance without establishing a sequence of higher highs and higher lows or lower highs and lower lows, it may be better described as a range.

    CME Group also describes consolidation as a period in which price remains within a defined range before a possible continuation or reversal.


    How to Tell If a Trend Is Strong or Weak

    Market structure is the starting point, but you can examine additional evidence to understand the quality of a trend.

    1. Look at the Consistency of Swing Structure

    A clean sequence of HHs and HLs provides clearer bullish structure than a chart with frequent mixed highs and lows.

    Likewise, consistent LHs and LLs provide clearer bearish structure.

    2. Watch the Pullbacks

    In an uptrend, healthy-looking pullbacks often remain above important previous swing lows.

    In a downtrend, rallies may struggle to reclaim previous swing highs.

    The exact behavior varies by market and timeframe, so these observations should not be treated as guaranteed rules.

    3. Examine Support and Resistance

    Support and resistance can provide additional context.

    Support refers to areas where declining price may encounter buying interest, while resistance refers to areas where rising price may encounter selling pressure. CME Group explains that previous highs and lows, price levels, moving averages, and trendlines can all be used when identifying support and resistance.

    4. Consider Momentum and Volume

    Indicators such as moving averages, RSI and MACD can provide additional information about momentum and trend conditions.

    However, indicators should complement price structure rather than replace it.

    For example, an oscillator can remain overbought or oversold while a strong trend continues, so a single indicator reading should not automatically be treated as a reversal signal.


    Trend Continuation vs Trend Reversal

    One of the hardest parts of trend identification is deciding whether a market is experiencing a normal pullback or beginning a genuine reversal.

    Signs an Uptrend May Be Weakening

    Suppose a market has been forming:

    HH → HL → HH → HL

    Then it fails to create a meaningful new higher high.

    That alone does not necessarily mean the trend has reversed.

    But if price then breaks important structure and begins forming:

    LH → LL

    the evidence of a potential bearish transition becomes stronger.

    Signs a Downtrend May Be Weakening

    A downtrend might look like:

    LH → LL → LH → LL

    If price stops creating new lower lows, the downtrend may be losing momentum.

    If price then starts producing:

    HL → HH

    the market structure may be transitioning toward an uptrend.

    Why One Broken Level Does Not Automatically Confirm a Reversal

    A trendline break or failed high/low should generally be treated as information, not certainty.

    Fidelity notes that a break of a trendline can warn that the trend may be changing, but additional tools and signals should be used to confirm the change.

    CME Group likewise explains that reversal patterns can provide indications rather than absolute rules about what price will do next.

    That distinction matters because markets frequently produce temporary countertrend moves.


    Pullback vs Retracement vs Reversal

    These terms are related, but they describe different ideas.

    Pullback

    A pullback is a temporary move against the prevailing trend.

    For example, in an uptrend:

    HH → HL → HH

    The move from the new high down toward the higher low is a pullback.

    Retracement

    A retracement is also a move against the prior price direction. The term is often used when describing how much of a previous move price gives back.

    Reversal

    A reversal implies a more meaningful change in the prevailing direction.

    For example:

    Uptrend → structure weakens → lower high → lower low

    That sequence provides stronger evidence of a potential bearish transition than a simple temporary dip.

    The distinction is important because calling every pullback a reversal can lead to an incorrect interpretation of market structure.


    How Timeframes Change Trend Identification

    A market can have different trends on different timeframes.

    For example:

    • Weekly chart: Uptrend
    • Daily chart: Uptrend
    • 4-hour chart: Downtrend
    • 15-minute chart: Uptrend

    There is no contradiction.

    The shorter timeframe may simply represent a countertrend move inside the larger trend.

    Charts can be viewed across different time periods, and CME Group notes that traders select chart timeframes according to their trading horizon.

    A Simple Multi-Timeframe Approach

    If you want broader context:

    1. Start with a higher timeframe.
    2. Identify the major market structure.
    3. Move to a lower timeframe.
    4. Identify the current short-term structure.
    5. Compare the two.
    6. Avoid assuming the lower-timeframe trend represents the entire market.

    This helps prevent a short-term rally from being mistaken for a complete long-term reversal.


    Can Indicators Confirm an Uptrend or Downtrend?

    Indicators can provide additional context, but market structure should remain central when your goal is to identify the basic direction of price.

    Moving Averages

    Moving averages smooth price data and can help visualize directional movement.

    RSI

    The Relative Strength Index measures recent upward and downward price movement and is commonly used to study momentum.

    MACD

    MACD is another momentum-oriented indicator that can help traders examine changes in trend and momentum.

    Fidelity’s crypto chart education specifically discusses moving averages, MACD and RSI alongside trend analysis.

    The key point is simple:

    Use indicators as supporting evidence, not as a replacement for reading price structure.


    How to Identify Market Trends in Crypto

    Crypto markets can be particularly useful for practicing trend identification because major tokens can experience substantial price movements across different timeframes.

    The same basic framework applies:

    Bullish crypto structure

    Higher High → Higher Low → Higher High → Higher Low

    Bearish crypto structure

    Lower High → Lower Low → Lower High → Lower Low

    Consolidation

    Repeated movement inside a relatively defined range

    When studying a cryptocurrency, first identify the structure before looking for more complicated indicators.

    You can then use OfferBin’s live crypto price tracker to check current market prices and its token converter to compare supported assets. OfferBin describes its service as a live price tracker and converter rather than an exchange or custody platform.

    For broader Bitcoin price context, you can also read OfferBin’s guide on Bitcoin price movement and the factors affecting its trend.


    Common Mistakes When Identifying Trends

    Mistake 1: Looking at Only One High

    A single higher high does not automatically establish an uptrend.

    Look at the surrounding swing lows and previous structure.

    Mistake 2: Looking at Only One Low

    The same applies to a single lower low.

    A broader sequence provides more useful information.

    Mistake 3: Treating Every Wick as a Major Swing

    Tiny price fluctuations can create many apparent highs and lows.

    Focus on meaningful swings relevant to your chosen timeframe.

    Mistake 4: Ignoring the Timeframe

    A 15-minute downtrend can exist inside a daily uptrend.

    Always know which timeframe you are analyzing.

    Mistake 5: Calling Every Pullback a Reversal

    A temporary decline does not automatically end an uptrend.

    Look for meaningful structural changes.

    Mistake 6: Ignoring Sideways Markets

    Mixed highs and lows may indicate consolidation rather than a clear directional trend.

    Mistake 7: Relying on One Indicator

    An RSI or MACD reading should not automatically override what price structure is showing.

    Mistake 8: Assuming Trend Analysis Predicts the Future

    Technical analysis can help organize historical and current price behavior, but it cannot guarantee what the market will do next.


    A Simple Trend Identification Checklist

    Before labeling a market as an uptrend, ask:

    • Are important highs getting higher?
    • Are important lows getting higher?
    • Is the HH/HL sequence reasonably consistent?
    • Are pullbacks holding above meaningful previous lows?
    • Does the higher timeframe support the same direction?
    • Are support/resistance and other evidence consistent with the structure?

    Before labeling a market as a downtrend, ask:

    • Are important highs getting lower?
    • Are important lows getting lower?
    • Is the LH/LL sequence reasonably consistent?
    • Are rallies failing below meaningful previous highs?
    • Does the higher timeframe support the same direction?
    • Is other market evidence consistent with the bearish structure?

    If the answers are mixed, the market may be transitioning or consolidating rather than clearly trending.


    A Quick Example of Uptrend and Downtrend Structure

    Imagine a cryptocurrency begins at $100.

    Uptrend example

    • Price rises to $115 — Higher High
    • Falls to $108 — Higher Low
    • Rises to $125 — Higher High
    • Falls to $116 — Higher Low
    • Rises to $135 — Higher High

    The structure is:

    HH → HL → HH → HL → HH

    That is a classic bullish structure.

    Downtrend example

    Now imagine another asset starts at $100.

    • Falls to $90 — initial decline
    • Rises to $96 — Lower High
    • Falls to $82 — Lower Low
    • Rises to $89 — Lower High
    • Falls to $76 — Lower Low

    The structure becomes:

    LH → LL → LH → LL

    That is a classic bearish structure.

    These examples are simplified to demonstrate structure rather than predict any particular asset’s future movement.


    How to Read Market Structure Faster

    Once you understand HH, HL, LH and LL, you can simplify your chart-reading process.

    Step 1: Zoom out

    Start with a timeframe large enough to see meaningful swings.

    Step 2: Find the obvious peaks and troughs

    Do not begin with every small candle.

    Step 3: Label the swings

    Mark:

    • HH
    • HL
    • LH
    • LL

    Step 4: Look for repetition

    One point is information.

    A sequence is structure.

    Step 5: Check for consolidation

    If the structure is mixed, do not force the market into an uptrend or downtrend category.

    Step 6: Check another timeframe

    See whether the short-term structure agrees with the broader market structure.

    Step 7: Look for confirmation

    Use support/resistance, momentum, volume, trendlines or indicators as additional evidence where appropriate.


    Frequently Asked Questions

    What is an uptrend?

    An uptrend is a market condition in which price generally forms a sequence of higher highs and higher lows. The rising swing structure indicates that successive peaks and pullbacks are occurring at progressively higher levels.

    What is a downtrend?

    A downtrend is a market condition in which price generally forms lower highs and lower lows. Each significant rally fails below the previous high while declines create progressively lower lows.

    What do higher highs and higher lows mean?

    A higher high means a new significant peak is above the previous peak. A higher low means a new significant trough remains above the previous trough. Together, repeated HHs and HLs form the basic structure of an uptrend.

    What do lower highs and lower lows mean?

    A lower high occurs when a rally ends below the previous significant high. A lower low occurs when price falls below the previous significant low. Repeated LHs and LLs form the basic structure of a downtrend.

    How do you identify an uptrend on a chart?

    Identify the major swing highs and lows, then compare each one with the previous point. If price repeatedly creates higher highs and higher lows, the chart is showing an uptrend structure.

    How do you identify a downtrend on a chart?

    Identify the major swing highs and lows and compare them sequentially. A repeated pattern of lower highs and lower lows indicates a downtrend.

    Can a market be in an uptrend and downtrend at the same time?

    Yes, when you use different timeframes. A short-term downtrend can occur inside a longer-term uptrend. That is why timeframe selection matters when analyzing market structure.

    Does a lower high mean an uptrend has ended?

    Not necessarily. One lower high can be part of a temporary pullback or consolidation. Stronger evidence of a bearish transition comes from a broader change in structure, such as sustained lower highs and lower lows.

    Is a pullback the same as a trend reversal?

    No. A pullback is a temporary move against the prevailing trend, while a reversal implies a more meaningful change in direction. Confirmation is important because temporary countertrend movements can occur during established trends.

    Are indicators necessary to identify an uptrend or downtrend?

    No. Basic trend identification can be done by studying price structure and swing highs/lows. Indicators such as moving averages, RSI and MACD can provide additional context but should not be treated as infallible signals.


    Final Takeaway

    Learning how to identify uptrends and downtrends starts with one simple idea: study the sequence of meaningful highs and lows.

    Remember the four key structures:

    Higher High + Higher Low → Uptrend

    Lower High + Lower Low → Downtrend

    Mixed Structure → Possible Transition

    No Clear Direction → Possible Consolidation

    From there, add context with swing points, support and resistance, timeframe analysis, momentum and other technical tools.

    Most importantly, avoid making a trend decision from a single candle, one price spike, or one indicator reading. Trends are structures that develop over a sequence of price movements.

    For crypto market research, you can use OfferBin’s live prices and token conversion tools to check current market data while applying these concepts. OfferBin provides market data for 25+ tokens and explicitly states that its tools are for reference rather than trading or custody.

    If you want to continue building your crypto-market knowledge, the OfferBin blog provides additional crypto-focused educational content.


    Important Note

    Trend analysis is an educational framework for interpreting price behavior. It does not guarantee future price direction, and technical patterns can fail. Crypto assets can be highly volatile, so market-structure analysis should not be treated as personalized financial advice.

    Sources for Further Reading

    • Fidelity’s basic concepts of trend explains higher highs, higher lows, lower highs, lower lows, sideways markets and trendlines.
    • Fidelity’s crypto chart guide covers uptrends, downtrends, consolidation and common chart indicators.
    • Charles Schwab’s chart-reading guide provides additional context on trend structure and confirmation.
    • CME Group’s technical-analysis resources cover trends, reversals, support/resistance and indicators.