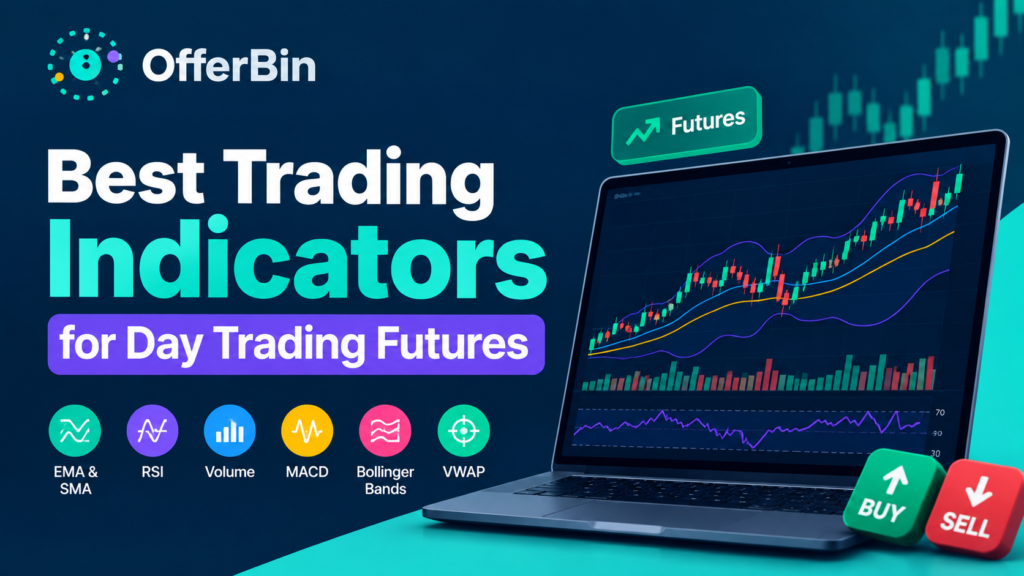
The best trading indicators for day trading futures depend on what you need to measure. VWAP can help assess intraday value, EMA can help identify trend direction, Volume Profile can show where trading activity has concentrated, while RSI, MACD, ATR, and Bollinger Bands provide momentum or volatility context. No single indicator works reliably in every market condition.
The goal is not to put as many indicators as possible on a chart. A better approach is to give each tool a specific job and combine only indicators that provide useful, non-redundant information.
Best Indicators for Day Trading Futures at a Glance
| Indicator | Main Category | What It Helps Measure | Common Use |
|---|---|---|---|
| VWAP | Value | Average traded price relative to volume | Intraday trend and value |
| EMA | Trend | Price direction and trend structure | Trend-following |
| Volume Profile | Volume/Market Structure | Where trading activity occurred | Value areas and key levels |
| RSI | Momentum | Momentum strength | Overbought/oversold context |
| MACD | Momentum/Trend | Momentum and trend changes | Confirmation |
| ATR | Volatility | Typical price range | Volatility and risk context |
| Bollinger Bands | Volatility | Price dispersion | Volatility expansion/contraction |
| Volume | Participation | Trading activity | Confirmation |
| Stochastic | Momentum | Closing price within a recent range | Range-bound markets |
| Opening Range | Market Structure | Early-session price range | Breakout analysis |
For many futures traders, a combination such as VWAP + EMA + volume/Volume Profile + ATR can provide a more balanced framework than stacking several momentum oscillators together.
What Are the Best Trading Indicators for Day Trading Futures?
There is no universally best futures indicator. Each indicator answers a different question.
- EMA: Where is price trending?
- VWAP: Where is price trading relative to the session’s volume-weighted average?
- Volume Profile: Where has the market accepted or rejected price?
- RSI: How strong is recent momentum?
- MACD: Is momentum changing relative to the underlying trend?
- ATR: How much is the market typically moving?
- Bollinger Bands: Is volatility expanding or contracting?
- Volume: How active is participation?
The most useful setup depends on the contract, timeframe, volatility regime, and trading style. An indicator that works well in a strongly trending session can produce very different signals in a sideways market.
How to Choose Futures Trading Indicators
Before adding an indicator, decide what information is missing from your chart.
For Trend Identification
Use a moving average such as an EMA when your main question is whether price is generally moving higher, lower, or sideways.
For Intraday Value
VWAP is particularly useful when you want to evaluate price relative to a session’s volume-weighted average.
For Market Structure
Volume Profile can help identify areas where substantial trading activity occurred, including the Point of Control and value-area concepts.
For Momentum
RSI, MACD, and Stochastic can help describe momentum, but they should not automatically be treated as reversal signals.
For Volatility
ATR and Bollinger Bands can help you understand whether current movement is relatively quiet or expanded.
This role-based approach reduces the temptation to use several indicators that are effectively measuring the same thing.
Best Trading Indicators for Day Trading Futures
1. VWAP
VWAP, or Volume-Weighted Average Price, measures the average price traded during a session while weighting prices by volume.
For intraday futures analysis, VWAP can provide a useful reference point for judging where the current price sits relative to the session’s volume-weighted average.
Why futures traders use VWAP
VWAP can help with:
- Identifying intraday market context
- Assessing whether price is above or below the session VWAP
- Studying pullbacks
- Identifying areas where price repeatedly interacts with a reference level
- Combining price location with volume information
How to use VWAP for futures day trading
Instead of treating every move through VWAP as a buy or sell signal, consider the surrounding market structure.
For example, a market that remains above VWAP while forming higher highs and higher lows presents a different context from a market repeatedly crossing VWAP while moving sideways.
👉VWAP is therefore more useful as a context tool than as a standalone signal generator.
VWAP limitation
VWAP does not tell you with certainty where price will move next. During choppy sessions, price can cross VWAP repeatedly and produce little directional information.
2. Exponential Moving Average (EMA)
An exponential moving average gives greater weight to recent prices than a simple moving average. This makes the EMA more responsive to recent price changes.
Day traders often use EMAs to study:
- Trend direction
- Pullbacks
- Dynamic support and resistance
- Momentum relative to a moving baseline
How to use EMA for futures trading
Suppose an index futures contract is making higher highs and higher lows while remaining above a rising EMA. A trader may interpret the EMA as part of the broader bullish trend structure.
If price repeatedly breaks below the EMA, however, the market context may be changing.
The important point is that the EMA should be interpreted alongside price structure rather than treated as an automatic entry signal.
EMA vs SMA
| Feature | EMA | SMA |
|---|---|---|
| Recent-price weighting | Higher | Equal |
| Responsiveness | Faster | Slower |
| Common use | Shorter-term trend analysis | Broader trend smoothing |
| Main drawback | More sensitive to noise | Can react more slowly |
There is no universally correct moving-average period. The appropriate setting depends on the timeframe and market being analyzed.
3. Volume Profile
Volume Profile displays trading activity according to price rather than simply showing volume as bars beneath a chart.
This makes it especially useful for studying market structure.
Common Volume Profile concepts include:
- Point of Control (POC)
- Value Area
- Value Area High
- Value Area Low
- High-volume nodes
- Low-volume nodes
Why Volume Profile matters for futures
Traditional volume tells you how much activity occurred during a period.
Volume Profile adds another question:
At which prices did that activity occur?
That distinction can help traders study areas where the market spent considerable time or where relatively little trading occurred.
Volume Profile limitation
A high-volume area does not automatically mean price must reverse there. It is better treated as market-structure information that needs to be interpreted alongside price action and other context.
4. Relative Strength Index (RSI)
The Relative Strength Index (RSI) is a momentum oscillator commonly displayed on a scale from 0 to 100.
Traditional interpretations often focus on:
- Above 70: potentially overbought
- Below 30: potentially oversold
But those levels should not be interpreted as automatic reversal commands.
RSI in futures day trading
RSI can help assess:
- Momentum strength
- Momentum deterioration
- Potential divergence
- Conditions within a trading range
A strong trend can keep RSI elevated for an extended period. Selling simply because RSI moves above 70 can therefore be misleading.
Better use of RSI
Instead of asking:
“Is RSI overbought?”
ask:
“What is RSI telling me about momentum within the current market structure?”
That produces a more useful interpretation.
5. Moving Average Convergence Divergence (MACD)
MACD is a momentum and trend-following indicator based on the relationship between exponential moving averages.
The traditional MACD calculation uses:
- 12-period EMA
- 26-period EMA
- 9-period EMA signal line
The histogram displays the difference between the MACD line and signal line.
What MACD can show
Traders commonly use MACD to examine:
- Momentum changes
- Trend direction
- Signal-line crossovers
- Centerline crosses
- Divergence
MACD limitation
MACD is derived from price data, so it is inherently lagging. In a rapidly changing futures market, a crossover can appear after part of the move has already occurred.
MACD is therefore generally more useful as confirmation and context than as a perfect timing mechanism.
6. Average True Range (ATR)
Average True Range (ATR) is a volatility indicator.
Unlike an indicator that tries to determine whether price is bullish or bearish, ATR focuses on the size of price movement.
That makes it useful for understanding whether a futures market is experiencing relatively low or high volatility.
How traders use ATR
ATR can help with:
- Understanding current volatility
- Comparing movement across periods
- Developing volatility-aware stop or target frameworks
- Avoiding unrealistic expectations about typical price movement
ATR does not tell you the direction of the next move.
It answers a different question:
How much is this market typically moving?
That distinction is important.
7. Bollinger Bands
Bollinger Bands combine a moving average with upper and lower bands based on standard deviation.
They can help traders study:
- Volatility expansion
- Volatility contraction
- Price relative to a moving average
- Potentially stretched conditions
Bollinger Bands for futures
When bands narrow, the market may be experiencing reduced volatility.
When bands widen, volatility is increasing.
But a narrow band does not guarantee a breakout, and touching an outer band does not automatically mean price will reverse.
The surrounding market structure still matters.
8. Trading Volume
Volume is one of the simplest and most important pieces of market information.
It tells you how many contracts were traded during a given period.
For futures traders, volume can help identify periods of increased or decreased activity and can be used alongside price movement for confirmation.
Volume and price together
Consider two hypothetical breakouts:
Scenario A: Price breaks resistance while volume expands.
Scenario B: Price breaks resistance while activity remains unusually weak.
The two situations may deserve different interpretations.
Volume does not tell you by itself whether traders are bullish or bearish. It tells you about trading activity, not the complete motivation behind every transaction.
9. Stochastic Oscillator
The Stochastic Oscillator compares a market’s closing price with its recent price range.
It is commonly used to study momentum and potential turning points.
Traditional interpretations often focus on:
- Overbought conditions
- Oversold conditions
- %K and %D crossovers
When Stochastic can be useful
It can be particularly informative when a market is moving within a relatively defined range.
In a strong trend, however, an oscillator can remain in an overbought or oversold area for longer than a trader expects.
That is why trend context matters.
10. Opening Range and NR4/NR7
Opening-range analysis focuses on price behavior during the early part of a trading session.
The NR4 and NR7 concepts focus on unusually narrow daily ranges relative to recent sessions.
The basic idea is to identify periods of contraction that may precede increased movement.
Why opening-range analysis matters
Futures markets can experience significant changes in activity around major session openings and scheduled events.
An opening range can provide a simple structural reference for studying:
- Breakouts
- Failed breakouts
- Early-session volatility
- Support and resistance
It should not be treated as a guarantee that a breakout will continue.
Advanced Indicators and Tools for Futures Trading
Traditional indicators are only part of the futures-analysis toolkit.
More advanced futures traders may also use market-structure and order-flow tools.
Footprint Charts
Footprint charts can display buying and selling activity at individual price levels depending on the platform and data configuration.
They are designed to provide more granular information than a standard candlestick chart.
Delta and Cumulative Delta
Delta-based tools compare buying and selling activity according to their underlying methodology.
They can be used to study whether aggressive buying or selling is increasing or decreasing.
Like other indicators, delta should be interpreted within context rather than treated as a guaranteed directional signal.
DOM and Market Depth
The Depth of Market (DOM) displays available orders at different price levels.
It can provide information about visible market depth and order-book activity.
However, displayed liquidity can change rapidly, so DOM information should not be interpreted as a permanent map of future price movement.
Best Indicator Combinations for Futures Day Trading
The most useful combination is usually not the one with the most indicators.
Instead, combine tools that answer different questions.
Simple Trend-Following Combination
EMA + VWAP + Volume
- EMA → trend context
- VWAP → intraday value
- Volume → participation
This gives you three different types of information without relying heavily on multiple oscillators.
Momentum Combination
EMA + RSI + Volume
The EMA provides trend context, RSI describes momentum, and volume provides participation context.
This can be useful when studying whether a move has enough participation to support the broader price structure.
Volatility Combination
VWAP + ATR + Bollinger Bands
This combination focuses more heavily on:
- Price location
- Volatility
- Range expansion/contraction
It can help distinguish a quiet market from a rapidly expanding one.
Market-Structure Combination
VWAP + Volume Profile + Price Action
This is useful when your primary goal is understanding where price is trading relative to areas of market activity and intraday value.
👉VWAP vs Moving Average for Day Trading
VWAP and moving averages can look similar on a chart, but they answer different questions.
| Feature | VWAP | Moving Average |
|---|---|---|
| Uses volume | Yes | No |
| Intraday value context | Strong | Limited |
| Trend identification | Useful | Strong |
| Common use | Session context | Trend/pullback analysis |
| Responds to price | Yes | Yes |
| Best interpretation | Price relative to volume-weighted value | Price relative to historical average |
VWAP is particularly useful when volume-weighted intraday context matters, while moving averages are commonly used to smooth price and identify trend direction.
They can therefore complement rather than replace one another.
RSI vs MACD for Futures Trading
RSI and MACD are both momentum-related tools, but their construction and presentation differ.
| Feature | RSI | MACD |
|---|---|---|
| Type | Oscillator | Trend/momentum indicator |
| Typical scale | 0–100 | No fixed 0–100 scale |
| Overbought/oversold | Common interpretation | Not its primary function |
| Trend context | Moderate | Stronger |
| Momentum shifts | Yes | Yes |
| Divergence | Yes | Yes |
| Main limitation | Can remain extreme in trends | Can lag price changes |
Rather than deciding that one is universally better, choose based on the information you need.
What Indicators Are Best for ES and NQ Futures?
ES and NQ are both major equity-index futures contracts, but their price behavior can differ.
A practical charting framework can include:
ES
Consider focusing on:
- VWAP
- EMA
- Volume
- Volume Profile
- ATR
- Key session levels
NQ
Consider focusing on:
- VWAP
- EMA
- Volume
- Volume Profile
- ATR
- Momentum context
The important point is not that ES requires one indicator and NQ requires another.
Both markets should be evaluated according to their current volatility, liquidity, session behavior, price structure, and trading timeframe.
How Many Indicators Should a Day Trader Use?
There is no fixed number that every trader should use.
A useful rule is:
Every indicator should have a specific job.
For example:
- EMA → trend
- VWAP → value
- Volume → participation
- ATR → volatility
Adding another indicator that measures essentially the same information may create more visual noise without adding much information.
A chart with four complementary tools can therefore be more useful than a chart containing ten overlapping indicators.
Common Mistakes When Using Futures Trading Indicators
Using Too Many Indicators
More indicators do not automatically mean better analysis.
If several tools produce similar information, they may simply reinforce the same signal rather than independently confirming it.
Treating Overbought as an Automatic Sell Signal
An overbought reading does not guarantee an immediate decline.
Strong trends can keep momentum indicators elevated.
Ignoring Market Structure
Indicators are calculated from market data. They do not replace understanding:
- Higher highs
- Higher lows
- Lower highs
- Lower lows
- Support
- Resistance
- Breakouts
- Failed breakouts
- Consolidation
Using Fixed Settings Without Testing Context
Indicator settings that appear useful on one timeframe or market may behave differently elsewhere.
Confusing Confirmation With Prediction
An indicator can provide evidence about current market conditions without predicting the next candle with certainty.
Ignoring Volatility
A strategy that works during a quiet session may behave differently during a major volatility expansion.
ATR and other volatility measures can provide useful context.
Are Technical Indicators Enough for Futures Day Trading?
No.
Technical indicators are tools for interpreting market data, not complete trading systems.
A broader futures-analysis process may also consider:
- Price action
- Market structure
- Volume
- Volatility
- Liquidity
- Trading session
- Scheduled economic events
- Contract specifications
- Position sizing
- Risk limits
- Execution costs
Futures also involve leverage, which can magnify both gains and losses. A sound educational approach should therefore separate market analysis from risk management.
A Simple Framework for Combining Futures Indicators
If you’re building a chart from scratch, start with four questions:
1. What is the trend?
Use price structure and an EMA or another moving average.
2. Where is value?
Use VWAP and, where available, Volume Profile.
3. How strong is the move?
Use volume and a momentum indicator such as RSI or MACD.
4. How volatile is the market?
Use ATR or Bollinger Bands.
This framework keeps the chart focused.
Instead of asking:
“Which indicator gives the best signal?”
ask:
“What information am I missing, and which tool provides it most clearly?”
That shift can make technical analysis much easier to understand.
Frequently Asked Questions
What is the best indicator for day trading futures?
There is no single best indicator for every futures market or trading style. VWAP, EMA, Volume Profile, volume, ATR, RSI, and MACD each provide different information. A combination of complementary tools is generally more useful than relying on one indicator alone.
What indicators do futures traders use?
Common futures indicators include moving averages, VWAP, volume, Volume Profile, RSI, MACD, ATR, Bollinger Bands, Stochastic, and opening-range tools. More advanced traders may also use footprint charts, delta, cumulative delta, and market-depth tools.
Is VWAP good for futures day trading?
VWAP can be useful for studying intraday value and price location relative to the session’s volume-weighted average. It works best as part of broader market analysis rather than as an automatic buy or sell signal.
How do you use EMA for futures trading?
An EMA can help identify trend direction and study how price behaves around a dynamic average. Traders may compare price structure with the EMA to evaluate trends and pullbacks, but an EMA does not guarantee that a move will continue.
What is the best momentum indicator for futures?
RSI and MACD are widely used momentum indicators, while Stochastic is another option. None is universally best. RSI can help describe momentum strength, while MACD combines trend and momentum information.
What is the best volume indicator for futures?
Regular volume, VWAP, and Volume Profile each provide different types of volume information. Volume measures activity, VWAP combines price and volume into an intraday reference, and Volume Profile organizes activity by price.
Should I use VWAP or a moving average?
They serve different purposes. VWAP is useful for volume-weighted intraday value, while moving averages are commonly used to identify trend direction and smooth price data. Using both can provide complementary information.
Can indicators predict futures prices?
Indicators cannot reliably predict future prices with certainty. They transform historical or current market data into measurements that can help traders analyze trends, momentum, volatility, or market activity.
How many indicators should I use when day trading futures?
There is no universal number. A practical approach is to use a small group of complementary tools where each indicator has a distinct purpose. Avoid adding indicators simply because they generate additional signals.
What are the best indicators for ES and NQ?
VWAP, EMA, volume, Volume Profile, ATR, and momentum tools can all be useful when analyzing ES and NQ. The appropriate combination depends on the market’s current volatility, structure, timeframe, and trading approach.
Final Takeaway
The best trading indicators for day trading futures are not necessarily the indicators that produce the most signals.
A more useful framework is to assign each tool a specific role:
EMA for trend → VWAP for intraday value → Volume Profile for market structure → volume for participation → RSI or MACD for momentum → ATR for volatility.
From there, price action and market structure can provide the broader context.
Indicators are analytical tools, not guarantees. The most useful setup is the one that helps you understand the market clearly without turning the chart into a collection of conflicting signals.
For broader market and crypto information, you can also explore OfferBin, which provides live cryptocurrency prices and token conversion tools for reference. OfferBin is a price tracker and converter rather than a futures exchange or brokerage platform.